Blackfeet vs Immigrants from Barbados 8th Grade
COMPARE
Blackfeet
Immigrants from Barbados
8th Grade
8th Grade Comparison
Blackfeet
Immigrants from Barbados
96.0%
8TH GRADE
80.8/ 100
METRIC RATING
151st/ 347
METRIC RANK
94.5%
8TH GRADE
0.0/ 100
METRIC RATING
285th/ 347
METRIC RANK
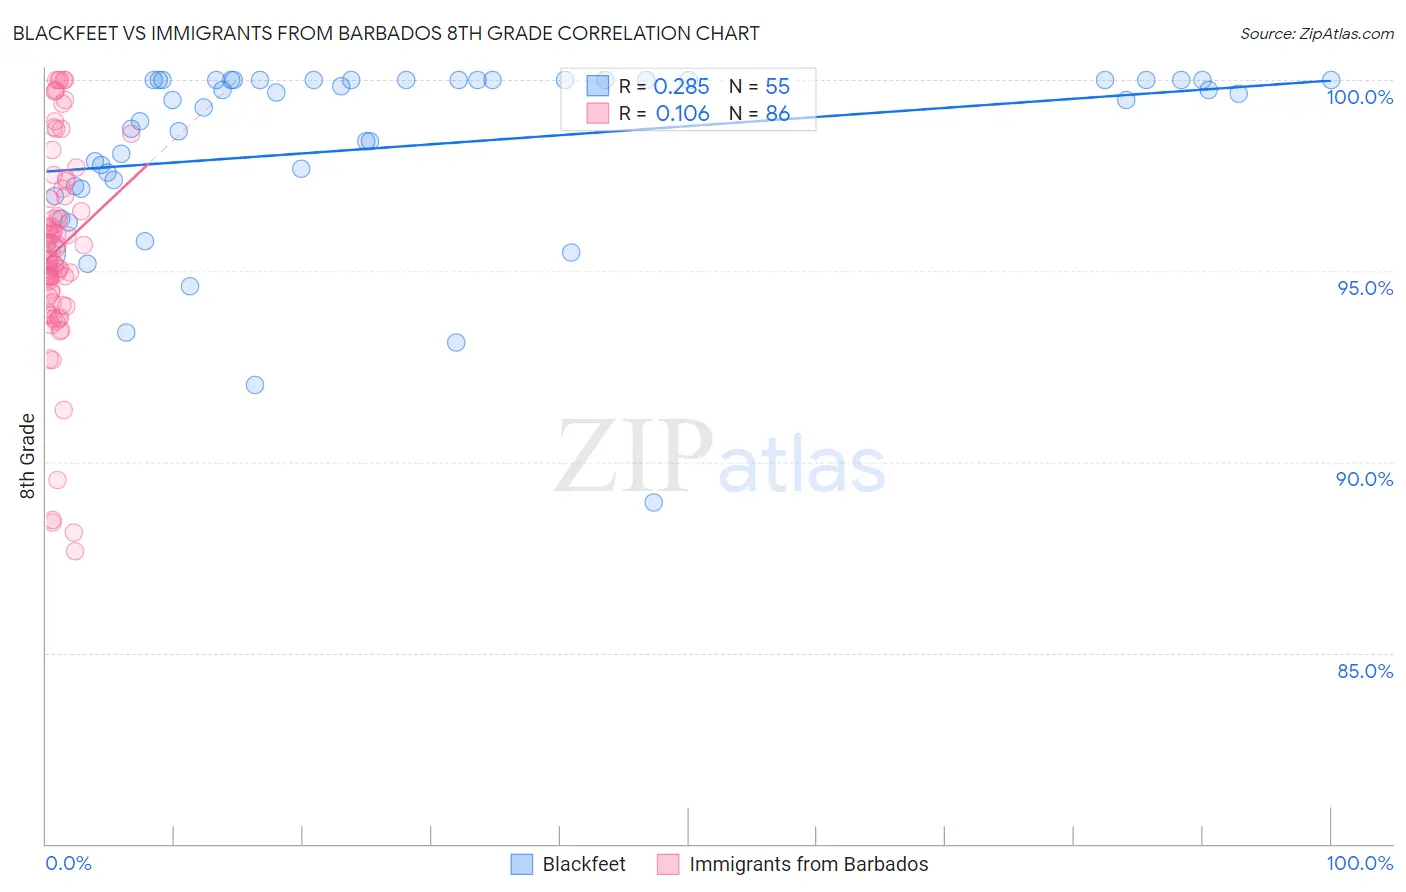
Blackfeet vs Immigrants from Barbados 8th Grade Correlation Chart
The statistical analysis conducted on geographies consisting of 309,580,893 people shows a weak positive correlation between the proportion of Blackfeet and percentage of population with at least 8th grade education in the United States with a correlation coefficient (R) of 0.285 and weighted average of 96.0%. Similarly, the statistical analysis conducted on geographies consisting of 112,787,165 people shows a poor positive correlation between the proportion of Immigrants from Barbados and percentage of population with at least 8th grade education in the United States with a correlation coefficient (R) of 0.106 and weighted average of 94.5%, a difference of 1.5%.
8th Grade Correlation Summary
| Measurement | Blackfeet | Immigrants from Barbados |
| Minimum | 88.9% | 87.6% |
| Maximum | 100.0% | 100.0% |
| Range | 11.1% | 12.4% |
| Mean | 98.3% | 95.6% |
| Median | 99.5% | 95.4% |
| Interquartile 25% (IQ1) | 97.2% | 94.3% |
| Interquartile 75% (IQ3) | 100.0% | 96.9% |
| Interquartile Range (IQR) | 2.8% | 2.6% |
| Standard Deviation (Sample) | 2.4% | 2.7% |
| Standard Deviation (Population) | 2.4% | 2.7% |
Similar Demographics by 8th Grade
Demographics Similar to Blackfeet by 8th Grade
In terms of 8th grade, the demographic groups most similar to Blackfeet are Immigrants from Russia (96.0%, a difference of 0.0%), French American Indian (96.0%, a difference of 0.0%), Immigrants from Israel (96.0%, a difference of 0.010%), Immigrants from Jordan (95.9%, a difference of 0.010%), and Hopi (95.9%, a difference of 0.010%).
| Demographics | Rating | Rank | 8th Grade |
| Immigrants | Belarus | 84.8 /100 | #144 | Excellent 96.0% |
| Lumbee | 84.1 /100 | #145 | Excellent 96.0% |
| Israelis | 84.1 /100 | #146 | Excellent 96.0% |
| Colville | 84.0 /100 | #147 | Excellent 96.0% |
| Albanians | 83.1 /100 | #148 | Excellent 96.0% |
| Immigrants | Israel | 81.3 /100 | #149 | Excellent 96.0% |
| Immigrants | Russia | 80.9 /100 | #150 | Excellent 96.0% |
| Blackfeet | 80.8 /100 | #151 | Excellent 96.0% |
| French American Indians | 80.6 /100 | #152 | Excellent 96.0% |
| Immigrants | Jordan | 79.5 /100 | #153 | Good 95.9% |
| Hopi | 79.4 /100 | #154 | Good 95.9% |
| Kenyans | 74.5 /100 | #155 | Good 95.9% |
| Ugandans | 74.1 /100 | #156 | Good 95.9% |
| Immigrants | Taiwan | 70.5 /100 | #157 | Good 95.9% |
| Arabs | 69.4 /100 | #158 | Good 95.9% |
Demographics Similar to Immigrants from Barbados by 8th Grade
In terms of 8th grade, the demographic groups most similar to Immigrants from Barbados are Immigrants from Philippines (94.6%, a difference of 0.030%), Immigrants from St. Vincent and the Grenadines (94.6%, a difference of 0.040%), Immigrants from Peru (94.5%, a difference of 0.050%), Tohono O'odham (94.5%, a difference of 0.060%), and Immigrants from Eritrea (94.6%, a difference of 0.070%).
| Demographics | Rating | Rank | 8th Grade |
| Armenians | 0.1 /100 | #278 | Tragic 94.7% |
| Immigrants | Trinidad and Tobago | 0.1 /100 | #279 | Tragic 94.6% |
| Barbadians | 0.1 /100 | #280 | Tragic 94.6% |
| Immigrants | Bolivia | 0.1 /100 | #281 | Tragic 94.6% |
| Immigrants | Eritrea | 0.1 /100 | #282 | Tragic 94.6% |
| Immigrants | St. Vincent and the Grenadines | 0.1 /100 | #283 | Tragic 94.6% |
| Immigrants | Philippines | 0.1 /100 | #284 | Tragic 94.6% |
| Immigrants | Barbados | 0.0 /100 | #285 | Tragic 94.5% |
| Immigrants | Peru | 0.0 /100 | #286 | Tragic 94.5% |
| Tohono O'odham | 0.0 /100 | #287 | Tragic 94.5% |
| Malaysians | 0.0 /100 | #288 | Tragic 94.5% |
| British West Indians | 0.0 /100 | #289 | Tragic 94.4% |
| Immigrants | West Indies | 0.0 /100 | #290 | Tragic 94.3% |
| Immigrants | Grenada | 0.0 /100 | #291 | Tragic 94.3% |
| Bangladeshis | 0.0 /100 | #292 | Tragic 94.3% |