Blackfeet vs Costa Rican In Labor Force | Age > 16
COMPARE
Blackfeet
Costa Rican
In Labor Force | Age > 16
In Labor Force | Age > 16 Comparison
Blackfeet
Costa Ricans
63.2%
IN LABOR FORCE | AGE > 16
0.0/ 100
METRIC RATING
311th/ 347
METRIC RANK
65.6%
IN LABOR FORCE | AGE > 16
93.2/ 100
METRIC RATING
134th/ 347
METRIC RANK
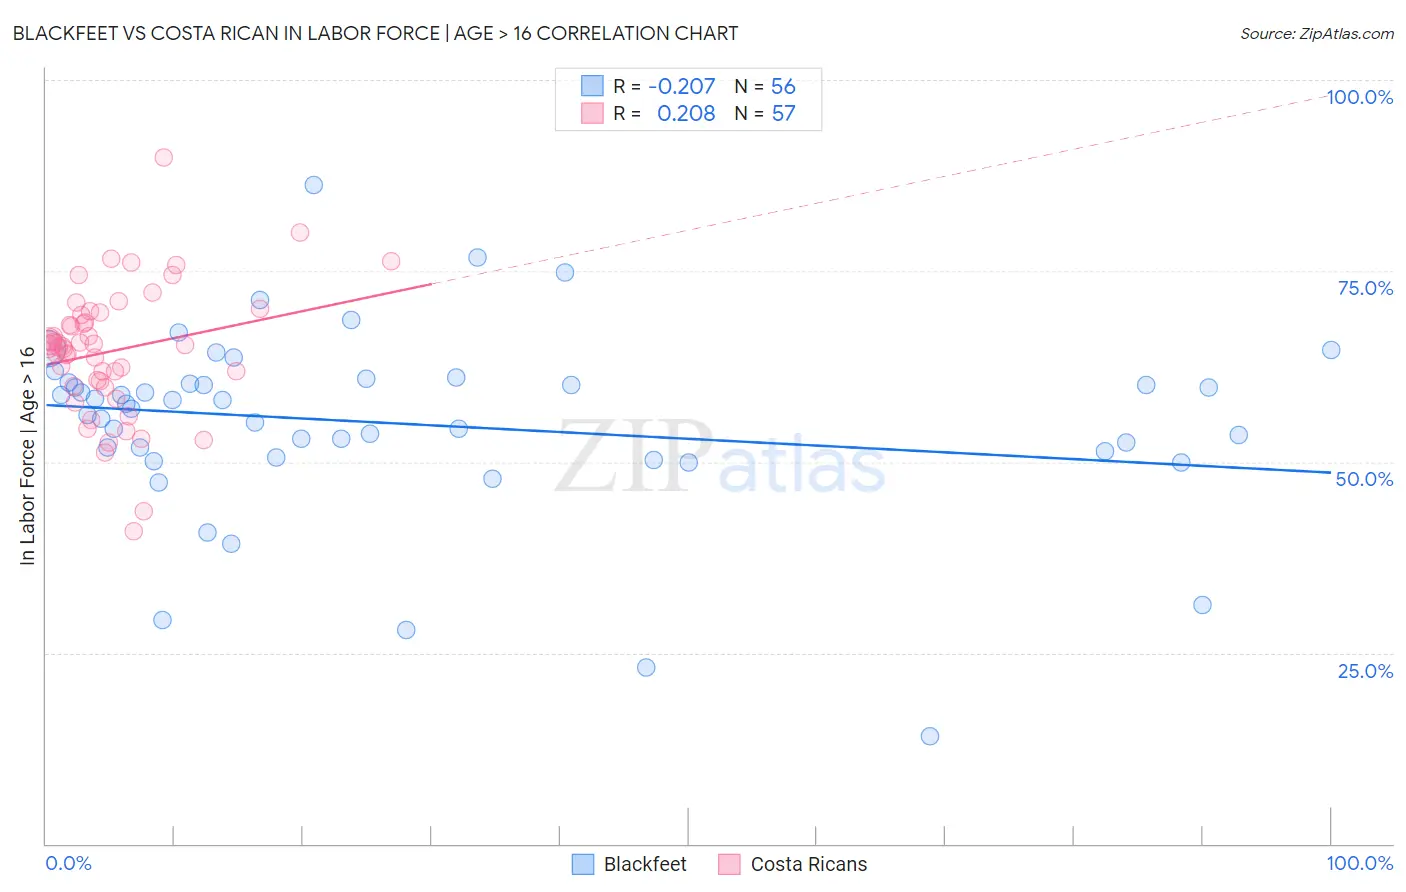
Blackfeet vs Costa Rican In Labor Force | Age > 16 Correlation Chart
The statistical analysis conducted on geographies consisting of 309,565,086 people shows a weak negative correlation between the proportion of Blackfeet and labor force participation rate among population ages 16 and over in the United States with a correlation coefficient (R) of -0.207 and weighted average of 63.2%. Similarly, the statistical analysis conducted on geographies consisting of 253,602,231 people shows a weak positive correlation between the proportion of Costa Ricans and labor force participation rate among population ages 16 and over in the United States with a correlation coefficient (R) of 0.208 and weighted average of 65.6%, a difference of 3.7%.
In Labor Force | Age > 16 Correlation Summary
| Measurement | Blackfeet | Costa Rican |
| Minimum | 14.1% | 40.9% |
| Maximum | 86.2% | 89.9% |
| Range | 72.1% | 49.0% |
| Mean | 55.0% | 64.5% |
| Median | 57.3% | 65.3% |
| Interquartile 25% (IQ1) | 51.0% | 60.2% |
| Interquartile 75% (IQ3) | 60.3% | 69.4% |
| Interquartile Range (IQR) | 9.3% | 9.2% |
| Standard Deviation (Sample) | 12.5% | 8.5% |
| Standard Deviation (Population) | 12.4% | 8.5% |
Similar Demographics by In Labor Force | Age > 16
Demographics Similar to Blackfeet by In Labor Force | Age > 16
In terms of in labor force | age > 16, the demographic groups most similar to Blackfeet are Shoshone (63.2%, a difference of 0.010%), Iroquois (63.2%, a difference of 0.060%), Scotch-Irish (63.3%, a difference of 0.080%), Chippewa (63.1%, a difference of 0.19%), and Pennsylvania German (63.4%, a difference of 0.21%).
| Demographics | Rating | Rank | In Labor Force | Age > 16 |
| Immigrants | Nonimmigrants | 0.0 /100 | #304 | Tragic 63.5% |
| Osage | 0.0 /100 | #305 | Tragic 63.5% |
| Blacks/African Americans | 0.0 /100 | #306 | Tragic 63.4% |
| Central American Indians | 0.0 /100 | #307 | Tragic 63.4% |
| Pennsylvania Germans | 0.0 /100 | #308 | Tragic 63.4% |
| Scotch-Irish | 0.0 /100 | #309 | Tragic 63.3% |
| Shoshone | 0.0 /100 | #310 | Tragic 63.2% |
| Blackfeet | 0.0 /100 | #311 | Tragic 63.2% |
| Iroquois | 0.0 /100 | #312 | Tragic 63.2% |
| Chippewa | 0.0 /100 | #313 | Tragic 63.1% |
| Yaqui | 0.0 /100 | #314 | Tragic 63.0% |
| Potawatomi | 0.0 /100 | #315 | Tragic 62.8% |
| Yup'ik | 0.0 /100 | #316 | Tragic 62.7% |
| Kiowa | 0.0 /100 | #317 | Tragic 62.4% |
| Chickasaw | 0.0 /100 | #318 | Tragic 62.3% |
Demographics Similar to Costa Ricans by In Labor Force | Age > 16
In terms of in labor force | age > 16, the demographic groups most similar to Costa Ricans are Immigrants from Lithuania (65.6%, a difference of 0.010%), Guatemalan (65.6%, a difference of 0.030%), Immigrants from Argentina (65.6%, a difference of 0.030%), Immigrants from North Macedonia (65.6%, a difference of 0.040%), and Guamanian/Chamorro (65.6%, a difference of 0.040%).
| Demographics | Rating | Rank | In Labor Force | Age > 16 |
| Immigrants | Eastern Asia | 94.9 /100 | #127 | Exceptional 65.7% |
| Ecuadorians | 94.7 /100 | #128 | Exceptional 65.6% |
| Immigrants | Philippines | 94.5 /100 | #129 | Exceptional 65.6% |
| Immigrants | Guatemala | 94.4 /100 | #130 | Exceptional 65.6% |
| Icelanders | 94.3 /100 | #131 | Exceptional 65.6% |
| Immigrants | North Macedonia | 94.1 /100 | #132 | Exceptional 65.6% |
| Immigrants | Lithuania | 93.5 /100 | #133 | Exceptional 65.6% |
| Costa Ricans | 93.2 /100 | #134 | Exceptional 65.6% |
| Guatemalans | 92.5 /100 | #135 | Exceptional 65.6% |
| Immigrants | Argentina | 92.4 /100 | #136 | Exceptional 65.6% |
| Guamanians/Chamorros | 92.4 /100 | #137 | Exceptional 65.6% |
| Immigrants | West Indies | 92.0 /100 | #138 | Exceptional 65.6% |
| Immigrants | Taiwan | 90.8 /100 | #139 | Exceptional 65.5% |
| Immigrants | Costa Rica | 90.8 /100 | #140 | Exceptional 65.5% |
| Samoans | 90.5 /100 | #141 | Exceptional 65.5% |