Bhutanese vs Immigrants from Poland In Labor Force | Age > 16
COMPARE
Bhutanese
Immigrants from Poland
In Labor Force | Age > 16
In Labor Force | Age > 16 Comparison
Bhutanese
Immigrants from Poland
65.5%
IN LABOR FORCE | AGE > 16
86.3/ 100
METRIC RATING
148th/ 347
METRIC RANK
65.8%
IN LABOR FORCE | AGE > 16
98.1/ 100
METRIC RATING
107th/ 347
METRIC RANK
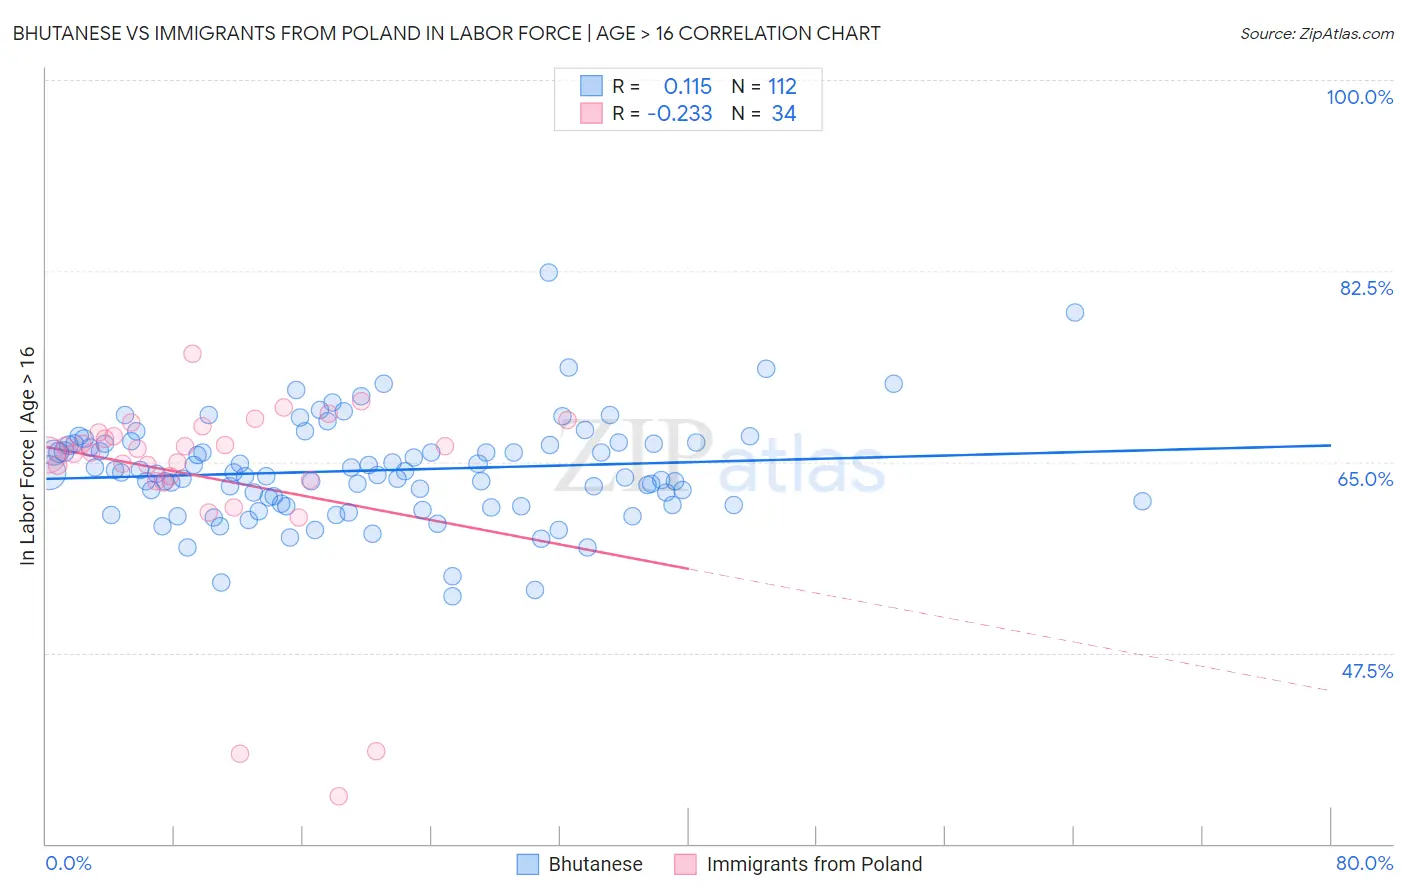
Bhutanese vs Immigrants from Poland In Labor Force | Age > 16 Correlation Chart
The statistical analysis conducted on geographies consisting of 455,605,488 people shows a poor positive correlation between the proportion of Bhutanese and labor force participation rate among population ages 16 and over in the United States with a correlation coefficient (R) of 0.115 and weighted average of 65.5%. Similarly, the statistical analysis conducted on geographies consisting of 304,860,925 people shows a weak negative correlation between the proportion of Immigrants from Poland and labor force participation rate among population ages 16 and over in the United States with a correlation coefficient (R) of -0.233 and weighted average of 65.8%, a difference of 0.59%.
In Labor Force | Age > 16 Correlation Summary
| Measurement | Bhutanese | Immigrants from Poland |
| Minimum | 52.7% | 34.3% |
| Maximum | 82.4% | 74.9% |
| Range | 29.7% | 40.6% |
| Mean | 64.2% | 63.6% |
| Median | 64.0% | 66.1% |
| Interquartile 25% (IQ1) | 61.1% | 63.3% |
| Interquartile 75% (IQ3) | 66.6% | 67.7% |
| Interquartile Range (IQR) | 5.6% | 4.4% |
| Standard Deviation (Sample) | 4.6% | 8.9% |
| Standard Deviation (Population) | 4.6% | 8.8% |
Similar Demographics by In Labor Force | Age > 16
Demographics Similar to Bhutanese by In Labor Force | Age > 16
In terms of in labor force | age > 16, the demographic groups most similar to Bhutanese are Immigrants from Albania (65.4%, a difference of 0.010%), Immigrants from Oceania (65.5%, a difference of 0.030%), Tlingit-Haida (65.5%, a difference of 0.050%), Cypriot (65.5%, a difference of 0.050%), and Immigrants from Romania (65.5%, a difference of 0.060%).
| Demographics | Rating | Rank | In Labor Force | Age > 16 |
| Samoans | 90.5 /100 | #141 | Exceptional 65.5% |
| Indians (Asian) | 89.5 /100 | #142 | Excellent 65.5% |
| Latvians | 89.4 /100 | #143 | Excellent 65.5% |
| Immigrants | Romania | 88.6 /100 | #144 | Excellent 65.5% |
| Tlingit-Haida | 88.3 /100 | #145 | Excellent 65.5% |
| Cypriots | 88.2 /100 | #146 | Excellent 65.5% |
| Immigrants | Oceania | 87.5 /100 | #147 | Excellent 65.5% |
| Bhutanese | 86.3 /100 | #148 | Excellent 65.5% |
| Immigrants | Albania | 85.7 /100 | #149 | Excellent 65.4% |
| Immigrants | Immigrants | 81.9 /100 | #150 | Excellent 65.4% |
| Czechs | 81.5 /100 | #151 | Excellent 65.4% |
| Yugoslavians | 81.3 /100 | #152 | Excellent 65.4% |
| Immigrants | China | 80.5 /100 | #153 | Excellent 65.4% |
| Immigrants | Eastern Europe | 78.3 /100 | #154 | Good 65.4% |
| Immigrants | Armenia | 76.6 /100 | #155 | Good 65.3% |
Demographics Similar to Immigrants from Poland by In Labor Force | Age > 16
In terms of in labor force | age > 16, the demographic groups most similar to Immigrants from Poland are Immigrants from Serbia (65.8%, a difference of 0.0%), Immigrants from Spain (65.8%, a difference of 0.010%), Immigrants from Japan (65.8%, a difference of 0.020%), Colombian (65.9%, a difference of 0.040%), and Palestinian (65.9%, a difference of 0.050%).
| Demographics | Rating | Rank | In Labor Force | Age > 16 |
| Okinawans | 98.7 /100 | #100 | Exceptional 65.9% |
| Immigrants | Colombia | 98.6 /100 | #101 | Exceptional 65.9% |
| Uruguayans | 98.6 /100 | #102 | Exceptional 65.9% |
| Immigrants | South Eastern Asia | 98.5 /100 | #103 | Exceptional 65.9% |
| Palestinians | 98.5 /100 | #104 | Exceptional 65.9% |
| Colombians | 98.4 /100 | #105 | Exceptional 65.9% |
| Immigrants | Serbia | 98.1 /100 | #106 | Exceptional 65.8% |
| Immigrants | Poland | 98.1 /100 | #107 | Exceptional 65.8% |
| Immigrants | Spain | 98.0 /100 | #108 | Exceptional 65.8% |
| Immigrants | Japan | 98.0 /100 | #109 | Exceptional 65.8% |
| Japanese | 97.7 /100 | #110 | Exceptional 65.8% |
| Immigrants | Honduras | 97.5 /100 | #111 | Exceptional 65.8% |
| Laotians | 97.4 /100 | #112 | Exceptional 65.8% |
| Pakistanis | 97.1 /100 | #113 | Exceptional 65.8% |
| Hondurans | 97.1 /100 | #114 | Exceptional 65.8% |