Bhutanese vs British In Labor Force | Age > 16
COMPARE
Bhutanese
British
In Labor Force | Age > 16
In Labor Force | Age > 16 Comparison
Bhutanese
British
65.5%
IN LABOR FORCE | AGE > 16
86.3/ 100
METRIC RATING
148th/ 347
METRIC RANK
64.7%
IN LABOR FORCE | AGE > 16
7.3/ 100
METRIC RATING
229th/ 347
METRIC RANK
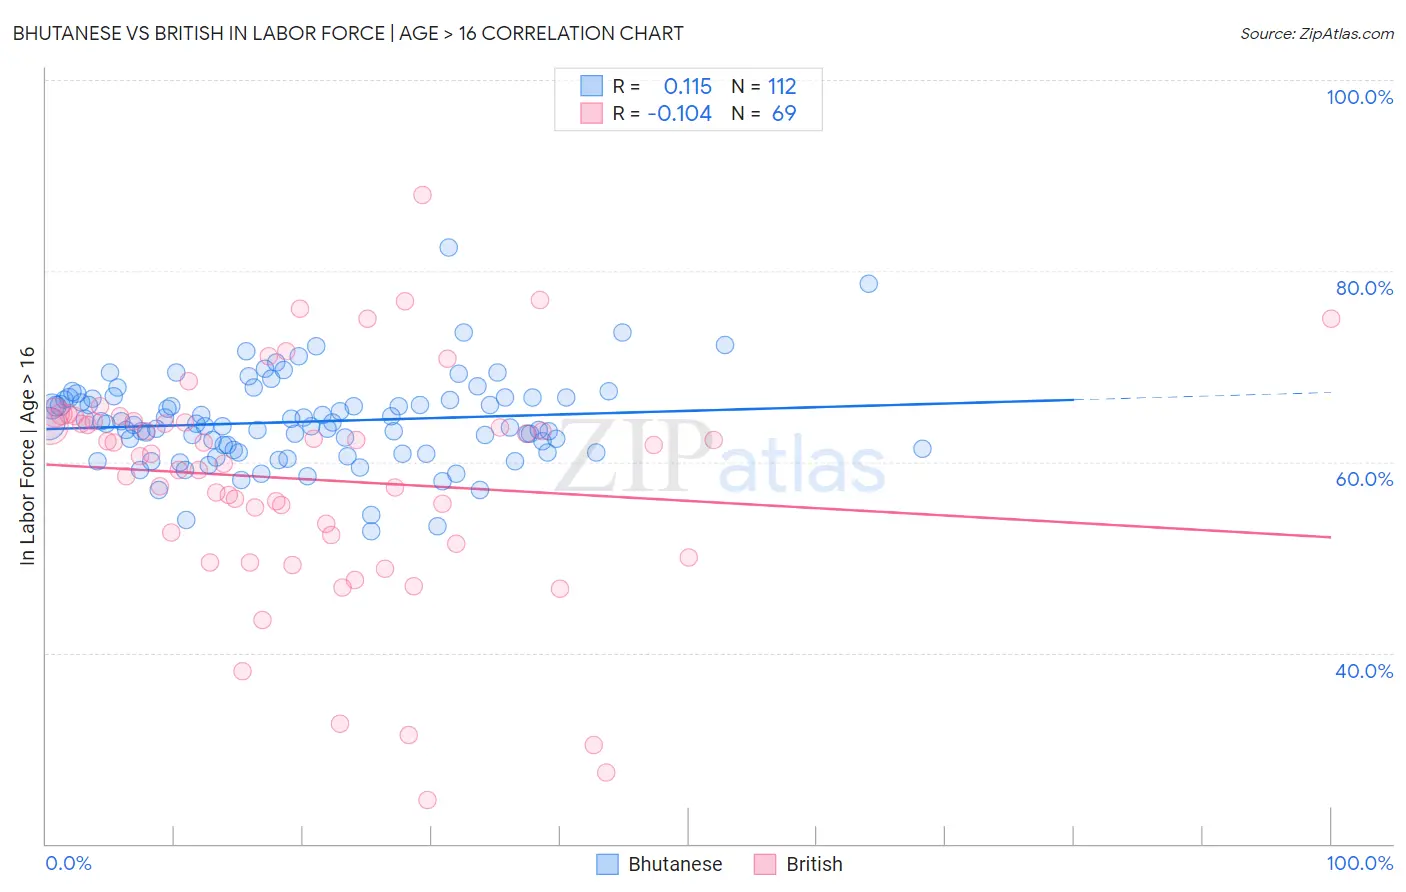
Bhutanese vs British In Labor Force | Age > 16 Correlation Chart
The statistical analysis conducted on geographies consisting of 455,605,488 people shows a poor positive correlation between the proportion of Bhutanese and labor force participation rate among population ages 16 and over in the United States with a correlation coefficient (R) of 0.115 and weighted average of 65.5%. Similarly, the statistical analysis conducted on geographies consisting of 531,501,445 people shows a poor negative correlation between the proportion of British and labor force participation rate among population ages 16 and over in the United States with a correlation coefficient (R) of -0.104 and weighted average of 64.7%, a difference of 1.2%.
In Labor Force | Age > 16 Correlation Summary
| Measurement | Bhutanese | British |
| Minimum | 52.7% | 24.6% |
| Maximum | 82.4% | 87.9% |
| Range | 29.7% | 63.3% |
| Mean | 64.2% | 58.2% |
| Median | 64.0% | 60.9% |
| Interquartile 25% (IQ1) | 61.1% | 51.9% |
| Interquartile 75% (IQ3) | 66.6% | 64.3% |
| Interquartile Range (IQR) | 5.6% | 12.5% |
| Standard Deviation (Sample) | 4.6% | 12.0% |
| Standard Deviation (Population) | 4.6% | 11.9% |
Similar Demographics by In Labor Force | Age > 16
Demographics Similar to Bhutanese by In Labor Force | Age > 16
In terms of in labor force | age > 16, the demographic groups most similar to Bhutanese are Immigrants from Albania (65.4%, a difference of 0.010%), Immigrants from Oceania (65.5%, a difference of 0.030%), Tlingit-Haida (65.5%, a difference of 0.050%), Cypriot (65.5%, a difference of 0.050%), and Immigrants from Romania (65.5%, a difference of 0.060%).
| Demographics | Rating | Rank | In Labor Force | Age > 16 |
| Samoans | 90.5 /100 | #141 | Exceptional 65.5% |
| Indians (Asian) | 89.5 /100 | #142 | Excellent 65.5% |
| Latvians | 89.4 /100 | #143 | Excellent 65.5% |
| Immigrants | Romania | 88.6 /100 | #144 | Excellent 65.5% |
| Tlingit-Haida | 88.3 /100 | #145 | Excellent 65.5% |
| Cypriots | 88.2 /100 | #146 | Excellent 65.5% |
| Immigrants | Oceania | 87.5 /100 | #147 | Excellent 65.5% |
| Bhutanese | 86.3 /100 | #148 | Excellent 65.5% |
| Immigrants | Albania | 85.7 /100 | #149 | Excellent 65.4% |
| Immigrants | Immigrants | 81.9 /100 | #150 | Excellent 65.4% |
| Czechs | 81.5 /100 | #151 | Excellent 65.4% |
| Yugoslavians | 81.3 /100 | #152 | Excellent 65.4% |
| Immigrants | China | 80.5 /100 | #153 | Excellent 65.4% |
| Immigrants | Eastern Europe | 78.3 /100 | #154 | Good 65.4% |
| Immigrants | Armenia | 76.6 /100 | #155 | Good 65.3% |
Demographics Similar to British by In Labor Force | Age > 16
In terms of in labor force | age > 16, the demographic groups most similar to British are Chinese (64.7%, a difference of 0.0%), Immigrants from Northern Europe (64.7%, a difference of 0.0%), European (64.7%, a difference of 0.040%), Polish (64.7%, a difference of 0.040%), and Northern European (64.7%, a difference of 0.040%).
| Demographics | Rating | Rank | In Labor Force | Age > 16 |
| Hawaiians | 9.3 /100 | #222 | Tragic 64.7% |
| Immigrants | Belize | 9.2 /100 | #223 | Tragic 64.7% |
| Immigrants | Jamaica | 8.8 /100 | #224 | Tragic 64.7% |
| Croatians | 8.8 /100 | #225 | Tragic 64.7% |
| Europeans | 8.3 /100 | #226 | Tragic 64.7% |
| Poles | 8.3 /100 | #227 | Tragic 64.7% |
| Northern Europeans | 8.2 /100 | #228 | Tragic 64.7% |
| British | 7.3 /100 | #229 | Tragic 64.7% |
| Chinese | 7.3 /100 | #230 | Tragic 64.7% |
| Immigrants | Northern Europe | 7.2 /100 | #231 | Tragic 64.7% |
| Africans | 5.8 /100 | #232 | Tragic 64.6% |
| Slavs | 4.9 /100 | #233 | Tragic 64.6% |
| Vietnamese | 4.7 /100 | #234 | Tragic 64.6% |
| Austrians | 4.6 /100 | #235 | Tragic 64.6% |
| Immigrants | Norway | 4.6 /100 | #236 | Tragic 64.6% |