Alaskan Athabascan vs Immigrants from Poland In Labor Force | Age > 16
COMPARE
Alaskan Athabascan
Immigrants from Poland
In Labor Force | Age > 16
In Labor Force | Age > 16 Comparison
Alaskan Athabascans
Immigrants from Poland
64.8%
IN LABOR FORCE | AGE > 16
13.9/ 100
METRIC RATING
212th/ 347
METRIC RANK
65.8%
IN LABOR FORCE | AGE > 16
98.1/ 100
METRIC RATING
107th/ 347
METRIC RANK
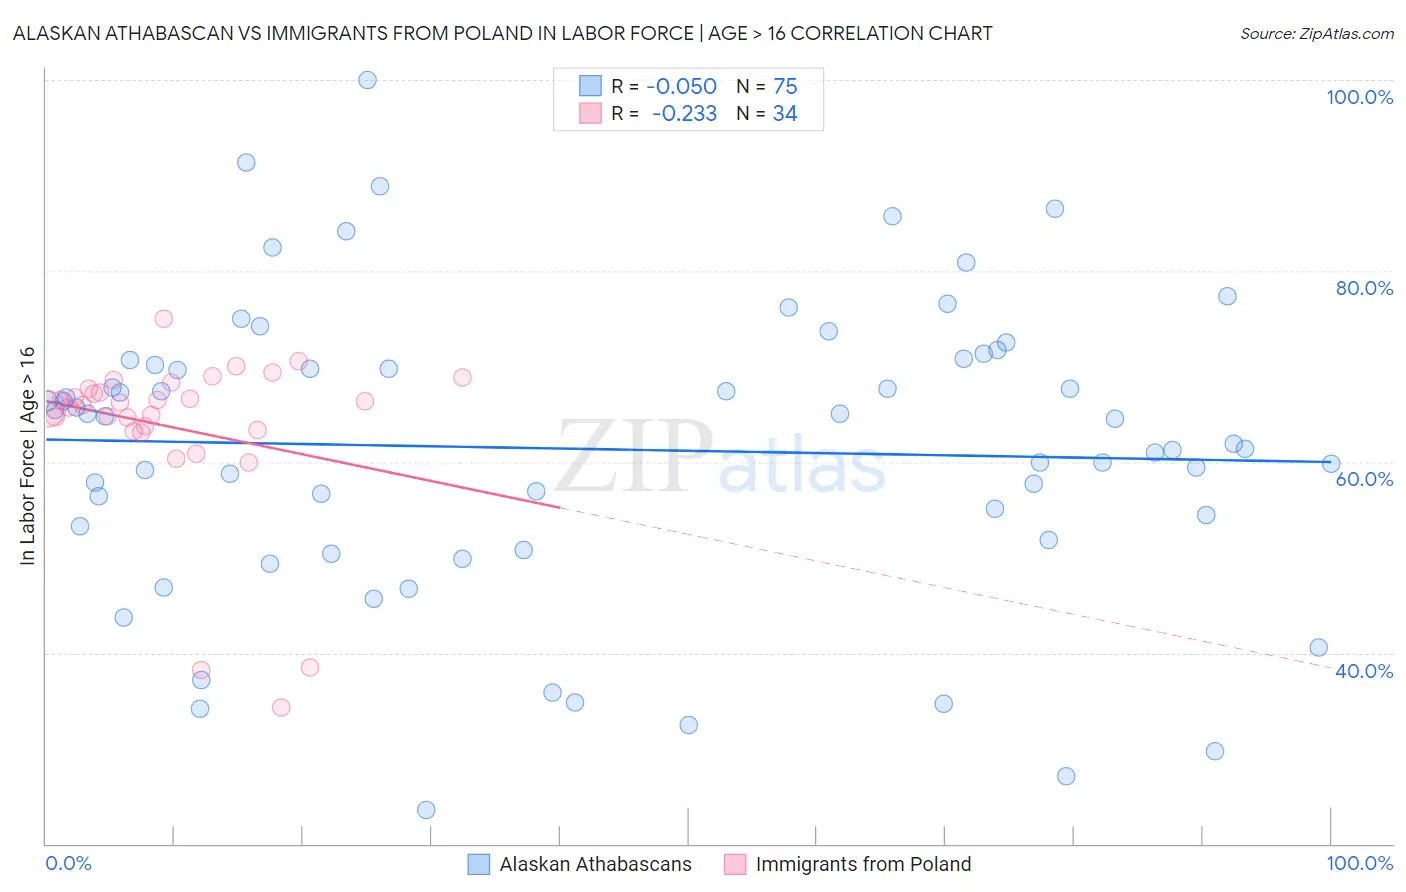
Alaskan Athabascan vs Immigrants from Poland In Labor Force | Age > 16 Correlation Chart
The statistical analysis conducted on geographies consisting of 45,821,503 people shows no correlation between the proportion of Alaskan Athabascans and labor force participation rate among population ages 16 and over in the United States with a correlation coefficient (R) of -0.050 and weighted average of 64.8%. Similarly, the statistical analysis conducted on geographies consisting of 304,860,925 people shows a weak negative correlation between the proportion of Immigrants from Poland and labor force participation rate among population ages 16 and over in the United States with a correlation coefficient (R) of -0.233 and weighted average of 65.8%, a difference of 1.6%.
In Labor Force | Age > 16 Correlation Summary
| Measurement | Alaskan Athabascan | Immigrants from Poland |
| Minimum | 23.6% | 34.3% |
| Maximum | 100.0% | 74.9% |
| Range | 76.4% | 40.6% |
| Mean | 61.3% | 63.6% |
| Median | 64.5% | 66.1% |
| Interquartile 25% (IQ1) | 51.8% | 63.3% |
| Interquartile 75% (IQ3) | 70.6% | 67.7% |
| Interquartile Range (IQR) | 18.8% | 4.4% |
| Standard Deviation (Sample) | 15.7% | 8.9% |
| Standard Deviation (Population) | 15.6% | 8.8% |
Similar Demographics by In Labor Force | Age > 16
Demographics Similar to Alaskan Athabascans by In Labor Force | Age > 16
In terms of in labor force | age > 16, the demographic groups most similar to Alaskan Athabascans are Maltese (64.8%, a difference of 0.0%), Fijian (64.8%, a difference of 0.010%), Immigrants from Denmark (64.8%, a difference of 0.020%), Estonian (64.8%, a difference of 0.020%), and Immigrants from Trinidad and Tobago (64.8%, a difference of 0.040%).
| Demographics | Rating | Rank | In Labor Force | Age > 16 |
| Jamaicans | 18.7 /100 | #205 | Poor 64.9% |
| Lithuanians | 17.4 /100 | #206 | Poor 64.8% |
| Immigrants | Latin America | 16.4 /100 | #207 | Poor 64.8% |
| Belizeans | 16.2 /100 | #208 | Poor 64.8% |
| Immigrants | Trinidad and Tobago | 15.6 /100 | #209 | Poor 64.8% |
| Immigrants | Denmark | 14.7 /100 | #210 | Poor 64.8% |
| Fijians | 14.1 /100 | #211 | Poor 64.8% |
| Alaskan Athabascans | 13.9 /100 | #212 | Poor 64.8% |
| Maltese | 13.8 /100 | #213 | Poor 64.8% |
| Estonians | 13.1 /100 | #214 | Poor 64.8% |
| Immigrants | Czechoslovakia | 12.3 /100 | #215 | Poor 64.8% |
| Belgians | 11.4 /100 | #216 | Poor 64.7% |
| U.S. Virgin Islanders | 11.3 /100 | #217 | Poor 64.7% |
| Alsatians | 10.7 /100 | #218 | Poor 64.7% |
| Immigrants | Central America | 10.5 /100 | #219 | Poor 64.7% |
Demographics Similar to Immigrants from Poland by In Labor Force | Age > 16
In terms of in labor force | age > 16, the demographic groups most similar to Immigrants from Poland are Immigrants from Serbia (65.8%, a difference of 0.0%), Immigrants from Spain (65.8%, a difference of 0.010%), Immigrants from Japan (65.8%, a difference of 0.020%), Colombian (65.9%, a difference of 0.040%), and Palestinian (65.9%, a difference of 0.050%).
| Demographics | Rating | Rank | In Labor Force | Age > 16 |
| Okinawans | 98.7 /100 | #100 | Exceptional 65.9% |
| Immigrants | Colombia | 98.6 /100 | #101 | Exceptional 65.9% |
| Uruguayans | 98.6 /100 | #102 | Exceptional 65.9% |
| Immigrants | South Eastern Asia | 98.5 /100 | #103 | Exceptional 65.9% |
| Palestinians | 98.5 /100 | #104 | Exceptional 65.9% |
| Colombians | 98.4 /100 | #105 | Exceptional 65.9% |
| Immigrants | Serbia | 98.1 /100 | #106 | Exceptional 65.8% |
| Immigrants | Poland | 98.1 /100 | #107 | Exceptional 65.8% |
| Immigrants | Spain | 98.0 /100 | #108 | Exceptional 65.8% |
| Immigrants | Japan | 98.0 /100 | #109 | Exceptional 65.8% |
| Japanese | 97.7 /100 | #110 | Exceptional 65.8% |
| Immigrants | Honduras | 97.5 /100 | #111 | Exceptional 65.8% |
| Laotians | 97.4 /100 | #112 | Exceptional 65.8% |
| Pakistanis | 97.1 /100 | #113 | Exceptional 65.8% |
| Hondurans | 97.1 /100 | #114 | Exceptional 65.8% |