Bhutanese vs Immigrants from Poland Median Earnings
COMPARE
Bhutanese
Immigrants from Poland
Median Earnings
Median Earnings Comparison
Bhutanese
Immigrants from Poland
$52,297
MEDIAN EARNINGS
100.0/ 100
METRIC RATING
46th/ 347
METRIC RANK
$49,633
MEDIAN EARNINGS
98.9/ 100
METRIC RATING
100th/ 347
METRIC RANK
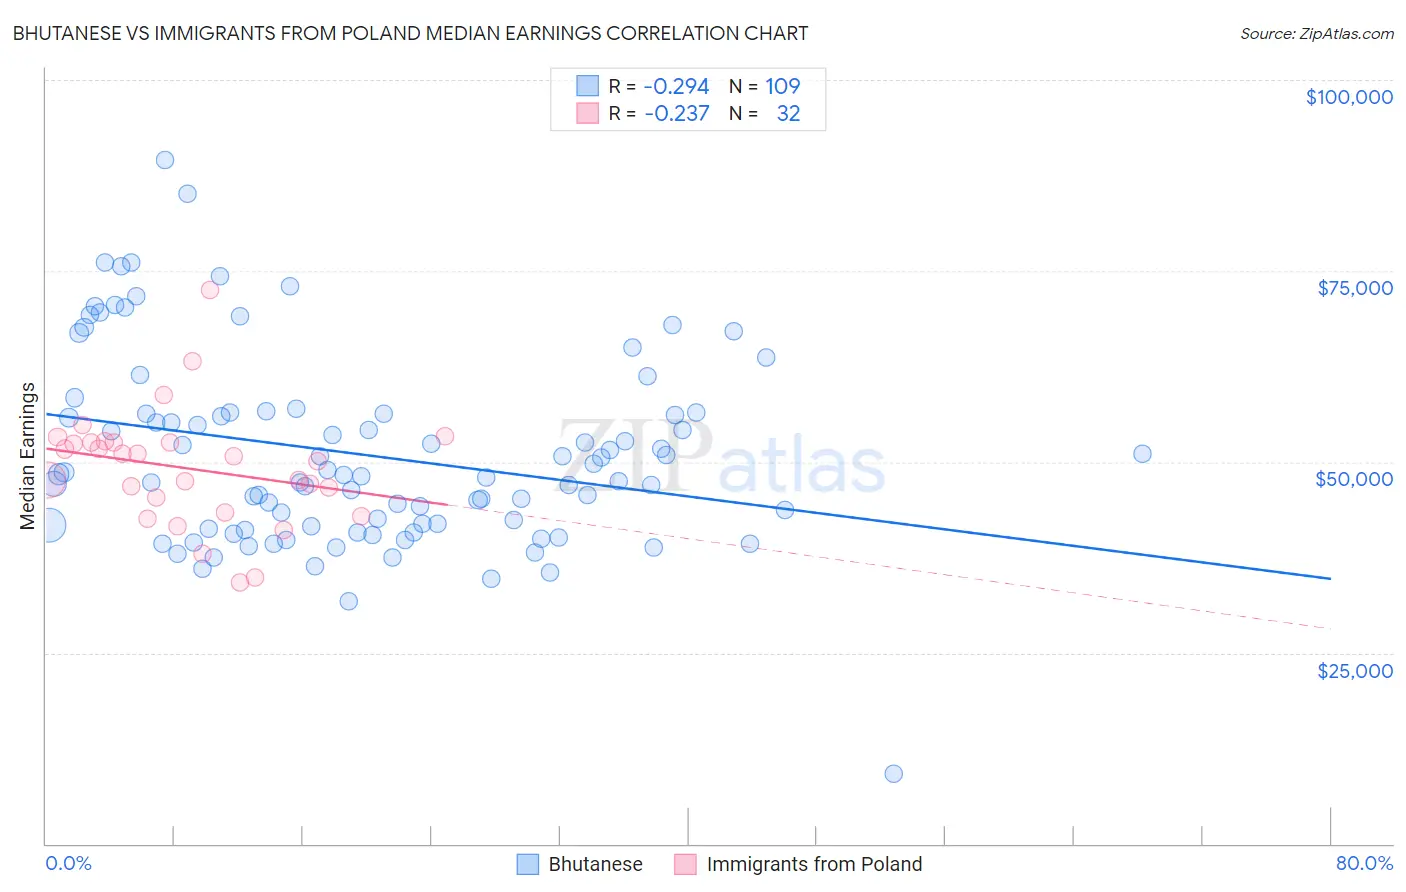
Bhutanese vs Immigrants from Poland Median Earnings Correlation Chart
The statistical analysis conducted on geographies consisting of 455,560,671 people shows a weak negative correlation between the proportion of Bhutanese and median earnings in the United States with a correlation coefficient (R) of -0.294 and weighted average of $52,297. Similarly, the statistical analysis conducted on geographies consisting of 304,849,071 people shows a weak negative correlation between the proportion of Immigrants from Poland and median earnings in the United States with a correlation coefficient (R) of -0.237 and weighted average of $49,633, a difference of 5.4%.
Median Earnings Correlation Summary
| Measurement | Bhutanese | Immigrants from Poland |
| Minimum | $9,211 | $34,220 |
| Maximum | $89,590 | $72,500 |
| Range | $80,379 | $38,280 |
| Mean | $50,906 | $49,130 |
| Median | $48,356 | $50,398 |
| Interquartile 25% (IQ1) | $41,435 | $44,359 |
| Interquartile 75% (IQ3) | $56,370 | $52,592 |
| Interquartile Range (IQR) | $14,935 | $8,233 |
| Standard Deviation (Sample) | $12,596 | $7,639 |
| Standard Deviation (Population) | $12,538 | $7,518 |
Similar Demographics by Median Earnings
Demographics Similar to Bhutanese by Median Earnings
In terms of median earnings, the demographic groups most similar to Bhutanese are Australian ($52,294, a difference of 0.010%), Immigrants from Czechoslovakia ($52,361, a difference of 0.12%), Immigrants from Europe ($52,195, a difference of 0.20%), Immigrants from Malaysia ($52,514, a difference of 0.41%), and Bulgarian ($52,512, a difference of 0.41%).
| Demographics | Rating | Rank | Median Earnings |
| Immigrants | Turkey | 100.0 /100 | #39 | Exceptional $52,960 |
| Israelis | 100.0 /100 | #40 | Exceptional $52,937 |
| Immigrants | Lithuania | 100.0 /100 | #41 | Exceptional $52,769 |
| Maltese | 100.0 /100 | #42 | Exceptional $52,526 |
| Immigrants | Malaysia | 100.0 /100 | #43 | Exceptional $52,514 |
| Bulgarians | 100.0 /100 | #44 | Exceptional $52,512 |
| Immigrants | Czechoslovakia | 100.0 /100 | #45 | Exceptional $52,361 |
| Bhutanese | 100.0 /100 | #46 | Exceptional $52,297 |
| Australians | 100.0 /100 | #47 | Exceptional $52,294 |
| Immigrants | Europe | 100.0 /100 | #48 | Exceptional $52,195 |
| Bolivians | 100.0 /100 | #49 | Exceptional $52,005 |
| Immigrants | South Africa | 100.0 /100 | #50 | Exceptional $51,850 |
| Immigrants | Austria | 99.9 /100 | #51 | Exceptional $51,826 |
| Estonians | 99.9 /100 | #52 | Exceptional $51,772 |
| Immigrants | Norway | 99.9 /100 | #53 | Exceptional $51,758 |
Demographics Similar to Immigrants from Poland by Median Earnings
In terms of median earnings, the demographic groups most similar to Immigrants from Poland are Jordanian ($49,632, a difference of 0.0%), Immigrants from Afghanistan ($49,645, a difference of 0.020%), Immigrants from Northern Africa ($49,648, a difference of 0.030%), Immigrants from North Macedonia ($49,658, a difference of 0.050%), and Immigrants from Lebanon ($49,682, a difference of 0.10%).
| Demographics | Rating | Rank | Median Earnings |
| Armenians | 99.1 /100 | #93 | Exceptional $49,804 |
| Croatians | 99.0 /100 | #94 | Exceptional $49,724 |
| Immigrants | England | 99.0 /100 | #95 | Exceptional $49,722 |
| Immigrants | Lebanon | 99.0 /100 | #96 | Exceptional $49,682 |
| Immigrants | North Macedonia | 98.9 /100 | #97 | Exceptional $49,658 |
| Immigrants | Northern Africa | 98.9 /100 | #98 | Exceptional $49,648 |
| Immigrants | Afghanistan | 98.9 /100 | #99 | Exceptional $49,645 |
| Immigrants | Poland | 98.9 /100 | #100 | Exceptional $49,633 |
| Jordanians | 98.9 /100 | #101 | Exceptional $49,632 |
| Ethiopians | 98.8 /100 | #102 | Exceptional $49,572 |
| Austrians | 98.7 /100 | #103 | Exceptional $49,501 |
| Immigrants | Brazil | 98.6 /100 | #104 | Exceptional $49,463 |
| Immigrants | Western Asia | 98.4 /100 | #105 | Exceptional $49,389 |
| Immigrants | Albania | 98.4 /100 | #106 | Exceptional $49,377 |
| Immigrants | Morocco | 98.4 /100 | #107 | Exceptional $49,368 |