Immigrants from Iraq vs Immigrants from Poland In Labor Force | Age > 16
COMPARE
Immigrants from Iraq
Immigrants from Poland
In Labor Force | Age > 16
In Labor Force | Age > 16 Comparison
Immigrants from Iraq
Immigrants from Poland
65.7%
IN LABOR FORCE | AGE > 16
95.5/ 100
METRIC RATING
123rd/ 347
METRIC RANK
65.8%
IN LABOR FORCE | AGE > 16
98.1/ 100
METRIC RATING
107th/ 347
METRIC RANK
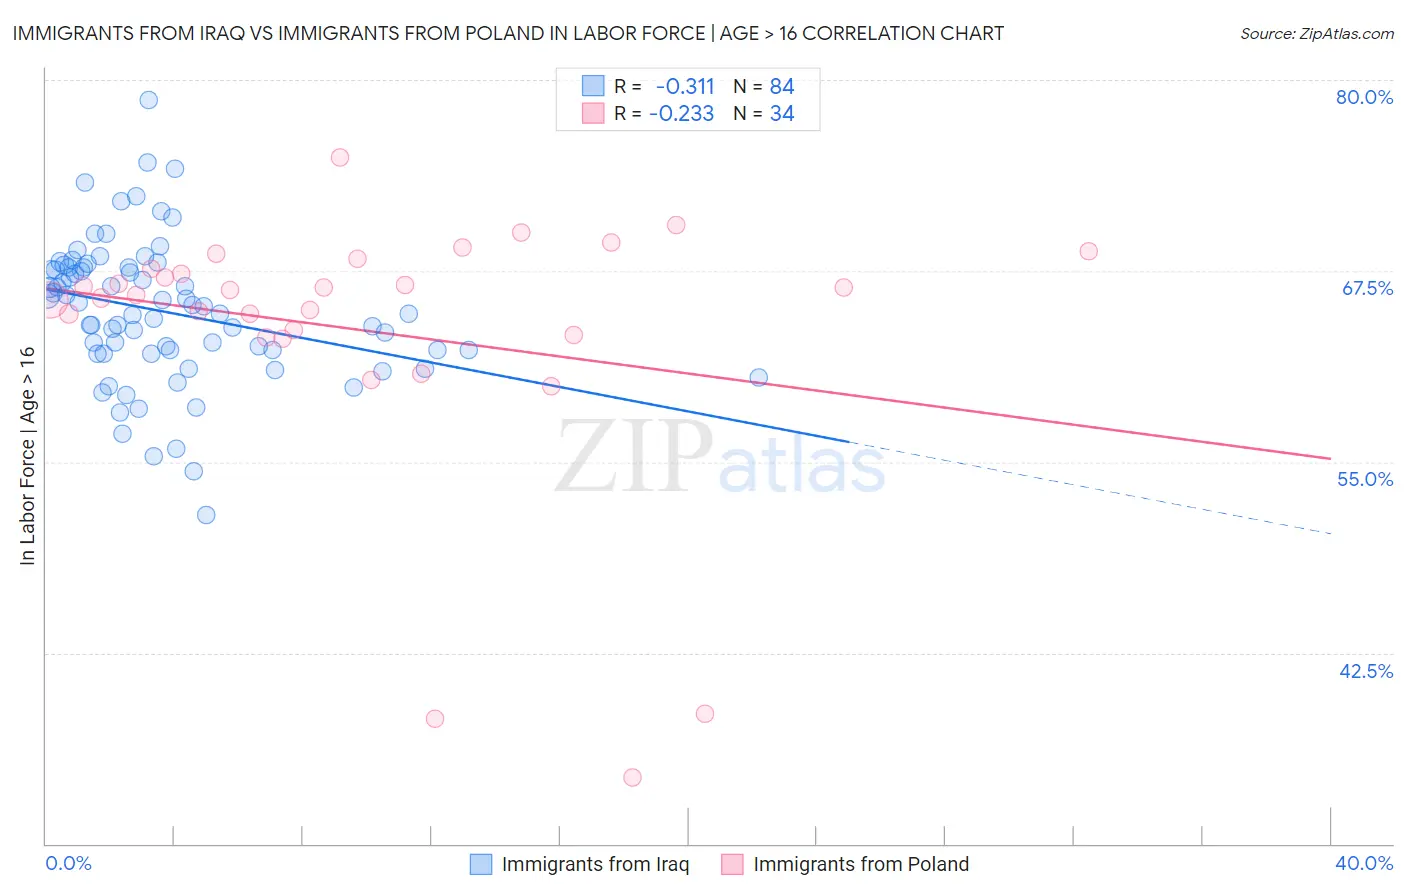
Immigrants from Iraq vs Immigrants from Poland In Labor Force | Age > 16 Correlation Chart
The statistical analysis conducted on geographies consisting of 194,783,152 people shows a mild negative correlation between the proportion of Immigrants from Iraq and labor force participation rate among population ages 16 and over in the United States with a correlation coefficient (R) of -0.311 and weighted average of 65.7%. Similarly, the statistical analysis conducted on geographies consisting of 304,860,925 people shows a weak negative correlation between the proportion of Immigrants from Poland and labor force participation rate among population ages 16 and over in the United States with a correlation coefficient (R) of -0.233 and weighted average of 65.8%, a difference of 0.25%.
In Labor Force | Age > 16 Correlation Summary
| Measurement | Immigrants from Iraq | Immigrants from Poland |
| Minimum | 51.5% | 34.3% |
| Maximum | 78.7% | 74.9% |
| Range | 27.2% | 40.6% |
| Mean | 64.8% | 63.6% |
| Median | 64.9% | 66.1% |
| Interquartile 25% (IQ1) | 62.2% | 63.3% |
| Interquartile 75% (IQ3) | 67.7% | 67.7% |
| Interquartile Range (IQR) | 5.5% | 4.4% |
| Standard Deviation (Sample) | 4.7% | 8.9% |
| Standard Deviation (Population) | 4.7% | 8.8% |
Demographics Similar to Immigrants from Iraq and Immigrants from Poland by In Labor Force | Age > 16
In terms of in labor force | age > 16, the demographic groups most similar to Immigrants from Iraq are Iraqi (65.7%, a difference of 0.0%), Norwegian (65.7%, a difference of 0.010%), Immigrants from Ecuador (65.7%, a difference of 0.030%), New Zealander (65.7%, a difference of 0.040%), and Immigrants from Hong Kong (65.7%, a difference of 0.050%). Similarly, the demographic groups most similar to Immigrants from Poland are Immigrants from Serbia (65.8%, a difference of 0.0%), Immigrants from Spain (65.8%, a difference of 0.010%), Immigrants from Japan (65.8%, a difference of 0.020%), Colombian (65.9%, a difference of 0.040%), and Japanese (65.8%, a difference of 0.050%).
| Demographics | Rating | Rank | In Labor Force | Age > 16 |
| Colombians | 98.4 /100 | #105 | Exceptional 65.9% |
| Immigrants | Serbia | 98.1 /100 | #106 | Exceptional 65.8% |
| Immigrants | Poland | 98.1 /100 | #107 | Exceptional 65.8% |
| Immigrants | Spain | 98.0 /100 | #108 | Exceptional 65.8% |
| Immigrants | Japan | 98.0 /100 | #109 | Exceptional 65.8% |
| Japanese | 97.7 /100 | #110 | Exceptional 65.8% |
| Immigrants | Honduras | 97.5 /100 | #111 | Exceptional 65.8% |
| Laotians | 97.4 /100 | #112 | Exceptional 65.8% |
| Pakistanis | 97.1 /100 | #113 | Exceptional 65.8% |
| Hondurans | 97.1 /100 | #114 | Exceptional 65.8% |
| Immigrants | Indonesia | 96.8 /100 | #115 | Exceptional 65.7% |
| Argentineans | 96.7 /100 | #116 | Exceptional 65.7% |
| Immigrants | Iran | 96.6 /100 | #117 | Exceptional 65.7% |
| Immigrants | Thailand | 96.6 /100 | #118 | Exceptional 65.7% |
| Immigrants | France | 96.4 /100 | #119 | Exceptional 65.7% |
| Immigrants | Hong Kong | 96.2 /100 | #120 | Exceptional 65.7% |
| New Zealanders | 96.0 /100 | #121 | Exceptional 65.7% |
| Immigrants | Ecuador | 95.9 /100 | #122 | Exceptional 65.7% |
| Immigrants | Iraq | 95.5 /100 | #123 | Exceptional 65.7% |
| Iraqis | 95.4 /100 | #124 | Exceptional 65.7% |
| Norwegians | 95.3 /100 | #125 | Exceptional 65.7% |