Immigrants from Guyana vs Immigrants from Poland In Labor Force | Age > 16
COMPARE
Immigrants from Guyana
Immigrants from Poland
In Labor Force | Age > 16
In Labor Force | Age > 16 Comparison
Immigrants from Guyana
Immigrants from Poland
64.0%
IN LABOR FORCE | AGE > 16
0.2/ 100
METRIC RATING
282nd/ 347
METRIC RANK
65.8%
IN LABOR FORCE | AGE > 16
98.1/ 100
METRIC RATING
107th/ 347
METRIC RANK
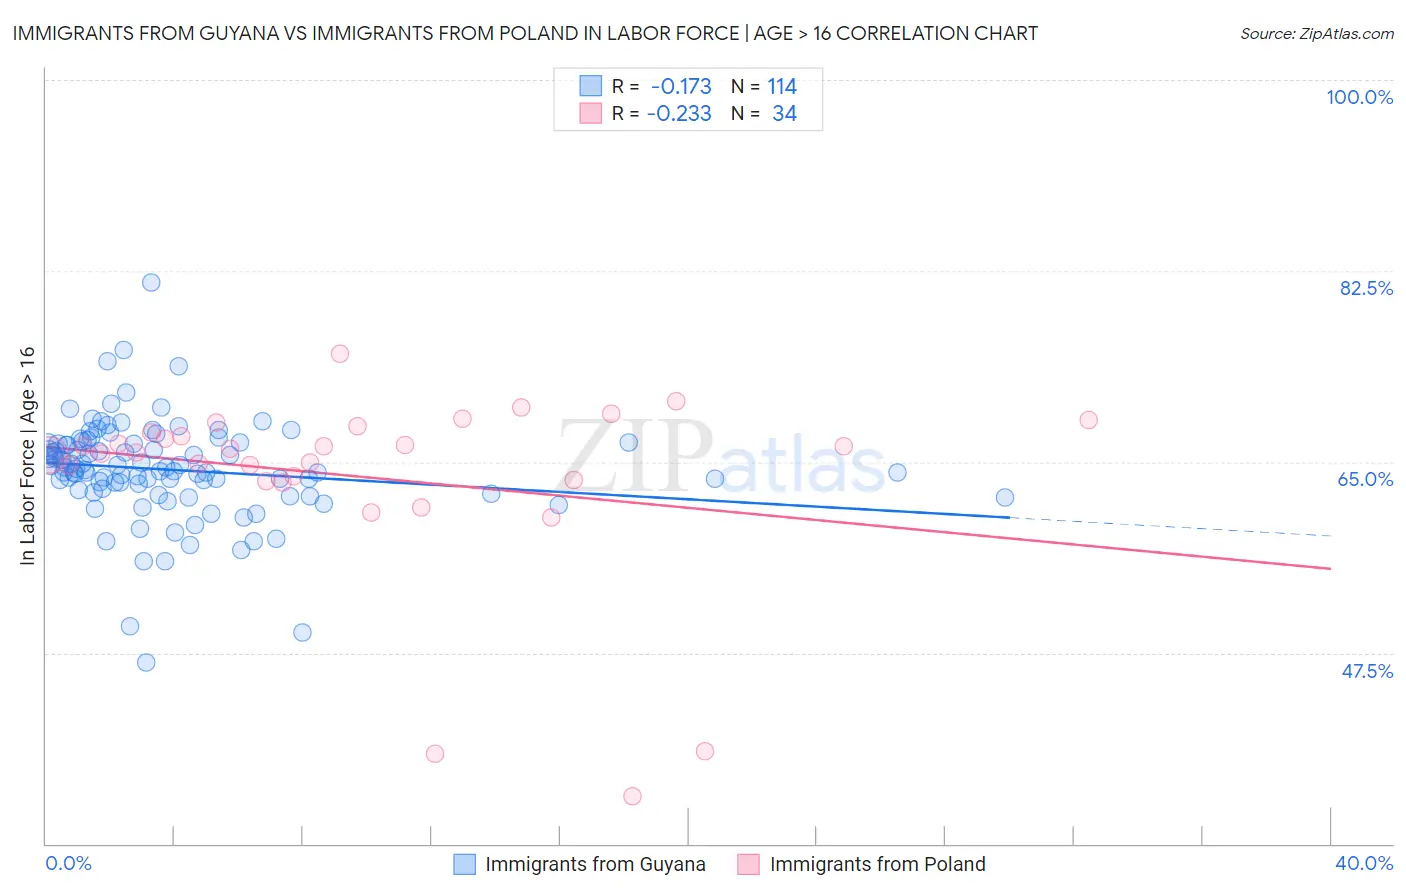
Immigrants from Guyana vs Immigrants from Poland In Labor Force | Age > 16 Correlation Chart
The statistical analysis conducted on geographies consisting of 183,746,738 people shows a poor negative correlation between the proportion of Immigrants from Guyana and labor force participation rate among population ages 16 and over in the United States with a correlation coefficient (R) of -0.173 and weighted average of 64.0%. Similarly, the statistical analysis conducted on geographies consisting of 304,860,925 people shows a weak negative correlation between the proportion of Immigrants from Poland and labor force participation rate among population ages 16 and over in the United States with a correlation coefficient (R) of -0.233 and weighted average of 65.8%, a difference of 2.9%.
In Labor Force | Age > 16 Correlation Summary
| Measurement | Immigrants from Guyana | Immigrants from Poland |
| Minimum | 46.6% | 34.3% |
| Maximum | 81.4% | 74.9% |
| Range | 34.8% | 40.6% |
| Mean | 64.3% | 63.6% |
| Median | 64.3% | 66.1% |
| Interquartile 25% (IQ1) | 62.5% | 63.3% |
| Interquartile 75% (IQ3) | 66.7% | 67.7% |
| Interquartile Range (IQR) | 4.2% | 4.4% |
| Standard Deviation (Sample) | 4.6% | 8.9% |
| Standard Deviation (Population) | 4.6% | 8.8% |
Similar Demographics by In Labor Force | Age > 16
Demographics Similar to Immigrants from Guyana by In Labor Force | Age > 16
In terms of in labor force | age > 16, the demographic groups most similar to Immigrants from Guyana are Immigrants from Germany (63.9%, a difference of 0.040%), French (63.9%, a difference of 0.060%), Immigrants from St. Vincent and the Grenadines (64.0%, a difference of 0.080%), French Canadian (64.0%, a difference of 0.080%), and Welsh (64.0%, a difference of 0.090%).
| Demographics | Rating | Rank | In Labor Force | Age > 16 |
| Mexicans | 0.3 /100 | #275 | Tragic 64.1% |
| French American Indians | 0.3 /100 | #276 | Tragic 64.1% |
| Immigrants | Bahamas | 0.3 /100 | #277 | Tragic 64.0% |
| Assyrians/Chaldeans/Syriacs | 0.3 /100 | #278 | Tragic 64.0% |
| Welsh | 0.2 /100 | #279 | Tragic 64.0% |
| Immigrants | St. Vincent and the Grenadines | 0.2 /100 | #280 | Tragic 64.0% |
| French Canadians | 0.2 /100 | #281 | Tragic 64.0% |
| Immigrants | Guyana | 0.2 /100 | #282 | Tragic 64.0% |
| Immigrants | Germany | 0.1 /100 | #283 | Tragic 63.9% |
| French | 0.1 /100 | #284 | Tragic 63.9% |
| Slovaks | 0.1 /100 | #285 | Tragic 63.9% |
| Immigrants | Austria | 0.1 /100 | #286 | Tragic 63.9% |
| Scottish | 0.1 /100 | #287 | Tragic 63.9% |
| Spanish | 0.1 /100 | #288 | Tragic 63.9% |
| Celtics | 0.1 /100 | #289 | Tragic 63.8% |
Demographics Similar to Immigrants from Poland by In Labor Force | Age > 16
In terms of in labor force | age > 16, the demographic groups most similar to Immigrants from Poland are Immigrants from Serbia (65.8%, a difference of 0.0%), Immigrants from Spain (65.8%, a difference of 0.010%), Immigrants from Japan (65.8%, a difference of 0.020%), Colombian (65.9%, a difference of 0.040%), and Palestinian (65.9%, a difference of 0.050%).
| Demographics | Rating | Rank | In Labor Force | Age > 16 |
| Okinawans | 98.7 /100 | #100 | Exceptional 65.9% |
| Immigrants | Colombia | 98.6 /100 | #101 | Exceptional 65.9% |
| Uruguayans | 98.6 /100 | #102 | Exceptional 65.9% |
| Immigrants | South Eastern Asia | 98.5 /100 | #103 | Exceptional 65.9% |
| Palestinians | 98.5 /100 | #104 | Exceptional 65.9% |
| Colombians | 98.4 /100 | #105 | Exceptional 65.9% |
| Immigrants | Serbia | 98.1 /100 | #106 | Exceptional 65.8% |
| Immigrants | Poland | 98.1 /100 | #107 | Exceptional 65.8% |
| Immigrants | Spain | 98.0 /100 | #108 | Exceptional 65.8% |
| Immigrants | Japan | 98.0 /100 | #109 | Exceptional 65.8% |
| Japanese | 97.7 /100 | #110 | Exceptional 65.8% |
| Immigrants | Honduras | 97.5 /100 | #111 | Exceptional 65.8% |
| Laotians | 97.4 /100 | #112 | Exceptional 65.8% |
| Pakistanis | 97.1 /100 | #113 | Exceptional 65.8% |
| Hondurans | 97.1 /100 | #114 | Exceptional 65.8% |