Bhutanese vs Immigrants from South America In Labor Force | Age > 16
COMPARE
Bhutanese
Immigrants from South America
In Labor Force | Age > 16
In Labor Force | Age > 16 Comparison
Bhutanese
Immigrants from South America
65.5%
IN LABOR FORCE | AGE > 16
86.3/ 100
METRIC RATING
148th/ 347
METRIC RANK
66.0%
IN LABOR FORCE | AGE > 16
99.1/ 100
METRIC RATING
93rd/ 347
METRIC RANK
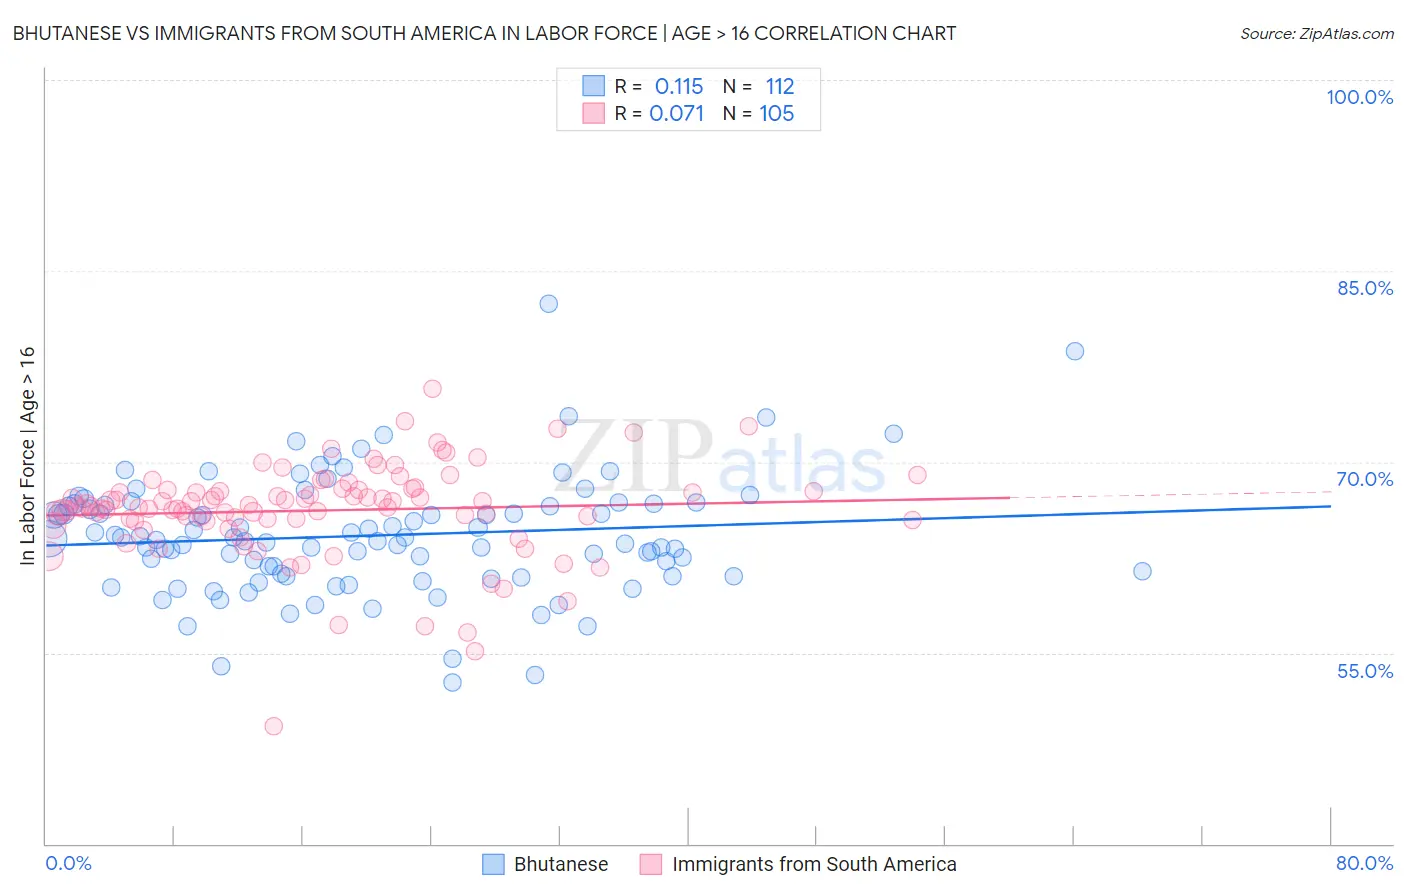
Bhutanese vs Immigrants from South America In Labor Force | Age > 16 Correlation Chart
The statistical analysis conducted on geographies consisting of 455,605,488 people shows a poor positive correlation between the proportion of Bhutanese and labor force participation rate among population ages 16 and over in the United States with a correlation coefficient (R) of 0.115 and weighted average of 65.5%. Similarly, the statistical analysis conducted on geographies consisting of 486,427,951 people shows a slight positive correlation between the proportion of Immigrants from South America and labor force participation rate among population ages 16 and over in the United States with a correlation coefficient (R) of 0.071 and weighted average of 66.0%, a difference of 0.81%.
In Labor Force | Age > 16 Correlation Summary
| Measurement | Bhutanese | Immigrants from South America |
| Minimum | 52.7% | 49.2% |
| Maximum | 82.4% | 75.7% |
| Range | 29.7% | 26.5% |
| Mean | 64.2% | 66.2% |
| Median | 64.0% | 66.5% |
| Interquartile 25% (IQ1) | 61.1% | 65.4% |
| Interquartile 75% (IQ3) | 66.6% | 67.8% |
| Interquartile Range (IQR) | 5.6% | 2.4% |
| Standard Deviation (Sample) | 4.6% | 3.8% |
| Standard Deviation (Population) | 4.6% | 3.8% |
Similar Demographics by In Labor Force | Age > 16
Demographics Similar to Bhutanese by In Labor Force | Age > 16
In terms of in labor force | age > 16, the demographic groups most similar to Bhutanese are Immigrants from Albania (65.4%, a difference of 0.010%), Immigrants from Oceania (65.5%, a difference of 0.030%), Tlingit-Haida (65.5%, a difference of 0.050%), Cypriot (65.5%, a difference of 0.050%), and Immigrants from Romania (65.5%, a difference of 0.060%).
| Demographics | Rating | Rank | In Labor Force | Age > 16 |
| Samoans | 90.5 /100 | #141 | Exceptional 65.5% |
| Indians (Asian) | 89.5 /100 | #142 | Excellent 65.5% |
| Latvians | 89.4 /100 | #143 | Excellent 65.5% |
| Immigrants | Romania | 88.6 /100 | #144 | Excellent 65.5% |
| Tlingit-Haida | 88.3 /100 | #145 | Excellent 65.5% |
| Cypriots | 88.2 /100 | #146 | Excellent 65.5% |
| Immigrants | Oceania | 87.5 /100 | #147 | Excellent 65.5% |
| Bhutanese | 86.3 /100 | #148 | Excellent 65.5% |
| Immigrants | Albania | 85.7 /100 | #149 | Excellent 65.4% |
| Immigrants | Immigrants | 81.9 /100 | #150 | Excellent 65.4% |
| Czechs | 81.5 /100 | #151 | Excellent 65.4% |
| Yugoslavians | 81.3 /100 | #152 | Excellent 65.4% |
| Immigrants | China | 80.5 /100 | #153 | Excellent 65.4% |
| Immigrants | Eastern Europe | 78.3 /100 | #154 | Good 65.4% |
| Immigrants | Armenia | 76.6 /100 | #155 | Good 65.3% |
Demographics Similar to Immigrants from South America by In Labor Force | Age > 16
In terms of in labor force | age > 16, the demographic groups most similar to Immigrants from South America are Aleut (66.0%, a difference of 0.010%), Immigrants from Cambodia (66.0%, a difference of 0.020%), Immigrants from Uruguay (66.0%, a difference of 0.020%), Immigrants from Laos (66.0%, a difference of 0.030%), and Chilean (66.0%, a difference of 0.030%).
| Demographics | Rating | Rank | In Labor Force | Age > 16 |
| South Americans | 99.4 /100 | #86 | Exceptional 66.0% |
| South American Indians | 99.4 /100 | #87 | Exceptional 66.0% |
| Bermudans | 99.3 /100 | #88 | Exceptional 66.0% |
| Immigrants | Laos | 99.2 /100 | #89 | Exceptional 66.0% |
| Chileans | 99.2 /100 | #90 | Exceptional 66.0% |
| Iranians | 99.2 /100 | #91 | Exceptional 66.0% |
| Aleuts | 99.1 /100 | #92 | Exceptional 66.0% |
| Immigrants | South America | 99.1 /100 | #93 | Exceptional 66.0% |
| Immigrants | Cambodia | 99.1 /100 | #94 | Exceptional 66.0% |
| Immigrants | Uruguay | 99.1 /100 | #95 | Exceptional 66.0% |
| Bangladeshis | 98.9 /100 | #96 | Exceptional 65.9% |
| Filipinos | 98.9 /100 | #97 | Exceptional 65.9% |
| Immigrants | Chile | 98.7 /100 | #98 | Exceptional 65.9% |
| Immigrants | Australia | 98.7 /100 | #99 | Exceptional 65.9% |
| Okinawans | 98.7 /100 | #100 | Exceptional 65.9% |