Bahamian vs Pueblo In Labor Force | Age 20-24
COMPARE
Bahamian
Pueblo
In Labor Force | Age 20-24
In Labor Force | Age 20-24 Comparison
Bahamians
Pueblo
73.3%
IN LABOR FORCE | AGE 20-24
0.1/ 100
METRIC RATING
280th/ 347
METRIC RANK
72.9%
IN LABOR FORCE | AGE 20-24
0.0/ 100
METRIC RATING
292nd/ 347
METRIC RANK
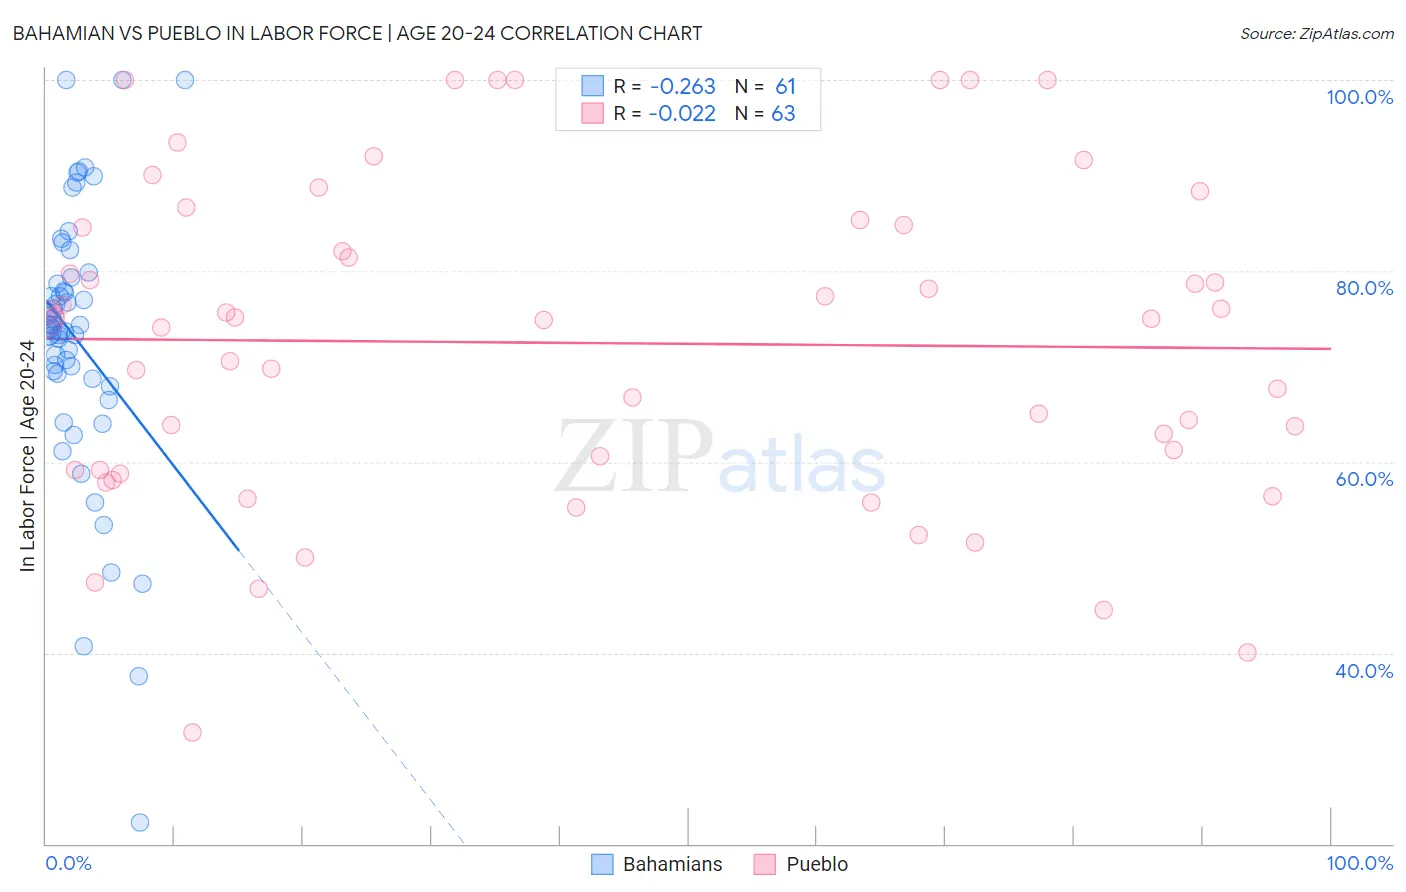
Bahamian vs Pueblo In Labor Force | Age 20-24 Correlation Chart
The statistical analysis conducted on geographies consisting of 112,697,524 people shows a weak negative correlation between the proportion of Bahamians and labor force participation rate among population between the ages 20 and 24 in the United States with a correlation coefficient (R) of -0.263 and weighted average of 73.3%. Similarly, the statistical analysis conducted on geographies consisting of 120,061,878 people shows no correlation between the proportion of Pueblo and labor force participation rate among population between the ages 20 and 24 in the United States with a correlation coefficient (R) of -0.022 and weighted average of 72.9%, a difference of 0.54%.
In Labor Force | Age 20-24 Correlation Summary
| Measurement | Bahamian | Pueblo |
| Minimum | 22.2% | 31.7% |
| Maximum | 100.0% | 100.0% |
| Range | 77.8% | 68.3% |
| Mean | 72.9% | 72.5% |
| Median | 74.0% | 75.0% |
| Interquartile 25% (IQ1) | 69.0% | 59.1% |
| Interquartile 75% (IQ3) | 79.0% | 84.8% |
| Interquartile Range (IQR) | 10.0% | 25.7% |
| Standard Deviation (Sample) | 14.3% | 16.7% |
| Standard Deviation (Population) | 14.1% | 16.6% |
Demographics Similar to Bahamians and Pueblo by In Labor Force | Age 20-24
In terms of in labor force | age 20-24, the demographic groups most similar to Bahamians are Immigrants from Venezuela (73.2%, a difference of 0.030%), Immigrants from Spain (73.2%, a difference of 0.040%), Immigrants from Bahamas (73.2%, a difference of 0.050%), Venezuelan (73.3%, a difference of 0.070%), and Kiowa (73.2%, a difference of 0.070%). Similarly, the demographic groups most similar to Pueblo are Immigrants from Belize (72.8%, a difference of 0.060%), Immigrants from Nicaragua (72.9%, a difference of 0.090%), Immigrants from Argentina (72.8%, a difference of 0.090%), Immigrants from Belarus (73.0%, a difference of 0.17%), and Okinawan (72.7%, a difference of 0.20%).
| Demographics | Rating | Rank | In Labor Force | Age 20-24 |
| Mongolians | 0.2 /100 | #276 | Tragic 73.3% |
| Immigrants | Malaysia | 0.2 /100 | #277 | Tragic 73.3% |
| Cypriots | 0.2 /100 | #278 | Tragic 73.3% |
| Venezuelans | 0.2 /100 | #279 | Tragic 73.3% |
| Bahamians | 0.1 /100 | #280 | Tragic 73.3% |
| Immigrants | Venezuela | 0.1 /100 | #281 | Tragic 73.2% |
| Immigrants | Spain | 0.1 /100 | #282 | Tragic 73.2% |
| Immigrants | Bahamas | 0.1 /100 | #283 | Tragic 73.2% |
| Kiowa | 0.1 /100 | #284 | Tragic 73.2% |
| Nicaraguans | 0.1 /100 | #285 | Tragic 73.2% |
| Immigrants | Lebanon | 0.1 /100 | #286 | Tragic 73.1% |
| Immigrants | Korea | 0.1 /100 | #287 | Tragic 73.1% |
| Argentineans | 0.1 /100 | #288 | Tragic 73.1% |
| U.S. Virgin Islanders | 0.1 /100 | #289 | Tragic 73.0% |
| Immigrants | Belarus | 0.1 /100 | #290 | Tragic 73.0% |
| Immigrants | Nicaragua | 0.0 /100 | #291 | Tragic 72.9% |
| Pueblo | 0.0 /100 | #292 | Tragic 72.9% |
| Immigrants | Belize | 0.0 /100 | #293 | Tragic 72.8% |
| Immigrants | Argentina | 0.0 /100 | #294 | Tragic 72.8% |
| Okinawans | 0.0 /100 | #295 | Tragic 72.7% |
| Jamaicans | 0.0 /100 | #296 | Tragic 72.7% |