Bahamian vs Yuman In Labor Force | Age 20-24
COMPARE
Bahamian
Yuman
In Labor Force | Age 20-24
In Labor Force | Age 20-24 Comparison
Bahamians
Yuman
73.3%
IN LABOR FORCE | AGE 20-24
0.1/ 100
METRIC RATING
280th/ 347
METRIC RANK
70.3%
IN LABOR FORCE | AGE 20-24
0.0/ 100
METRIC RATING
333rd/ 347
METRIC RANK
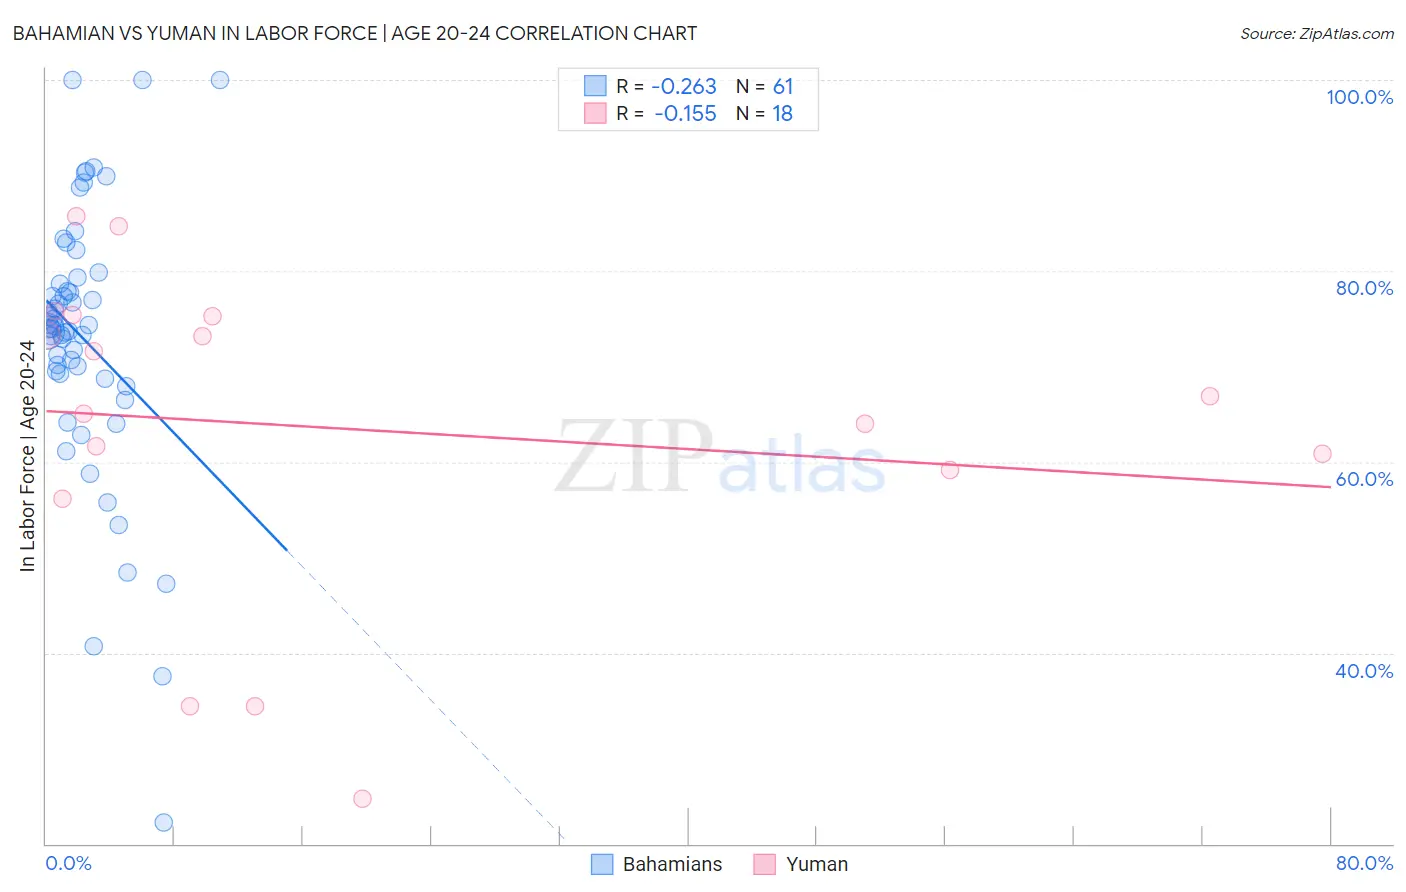
Bahamian vs Yuman In Labor Force | Age 20-24 Correlation Chart
The statistical analysis conducted on geographies consisting of 112,697,524 people shows a weak negative correlation between the proportion of Bahamians and labor force participation rate among population between the ages 20 and 24 in the United States with a correlation coefficient (R) of -0.263 and weighted average of 73.3%. Similarly, the statistical analysis conducted on geographies consisting of 40,677,141 people shows a poor negative correlation between the proportion of Yuman and labor force participation rate among population between the ages 20 and 24 in the United States with a correlation coefficient (R) of -0.155 and weighted average of 70.3%, a difference of 4.3%.
In Labor Force | Age 20-24 Correlation Summary
| Measurement | Bahamian | Yuman |
| Minimum | 22.2% | 24.7% |
| Maximum | 100.0% | 85.7% |
| Range | 77.8% | 61.0% |
| Mean | 72.9% | 63.4% |
| Median | 74.0% | 66.0% |
| Interquartile 25% (IQ1) | 69.0% | 59.1% |
| Interquartile 75% (IQ3) | 79.0% | 75.2% |
| Interquartile Range (IQR) | 10.0% | 16.1% |
| Standard Deviation (Sample) | 14.3% | 17.0% |
| Standard Deviation (Population) | 14.1% | 16.5% |
Similar Demographics by In Labor Force | Age 20-24
Demographics Similar to Bahamians by In Labor Force | Age 20-24
In terms of in labor force | age 20-24, the demographic groups most similar to Bahamians are Immigrants from Venezuela (73.2%, a difference of 0.030%), Immigrants from Spain (73.2%, a difference of 0.040%), Immigrants from Bahamas (73.2%, a difference of 0.050%), Venezuelan (73.3%, a difference of 0.070%), and Kiowa (73.2%, a difference of 0.070%).
| Demographics | Rating | Rank | In Labor Force | Age 20-24 |
| Cheyenne | 0.2 /100 | #273 | Tragic 73.4% |
| Immigrants | Colombia | 0.2 /100 | #274 | Tragic 73.4% |
| Immigrants | South America | 0.2 /100 | #275 | Tragic 73.3% |
| Mongolians | 0.2 /100 | #276 | Tragic 73.3% |
| Immigrants | Malaysia | 0.2 /100 | #277 | Tragic 73.3% |
| Cypriots | 0.2 /100 | #278 | Tragic 73.3% |
| Venezuelans | 0.2 /100 | #279 | Tragic 73.3% |
| Bahamians | 0.1 /100 | #280 | Tragic 73.3% |
| Immigrants | Venezuela | 0.1 /100 | #281 | Tragic 73.2% |
| Immigrants | Spain | 0.1 /100 | #282 | Tragic 73.2% |
| Immigrants | Bahamas | 0.1 /100 | #283 | Tragic 73.2% |
| Kiowa | 0.1 /100 | #284 | Tragic 73.2% |
| Nicaraguans | 0.1 /100 | #285 | Tragic 73.2% |
| Immigrants | Lebanon | 0.1 /100 | #286 | Tragic 73.1% |
| Immigrants | Korea | 0.1 /100 | #287 | Tragic 73.1% |
Demographics Similar to Yuman by In Labor Force | Age 20-24
In terms of in labor force | age 20-24, the demographic groups most similar to Yuman are Immigrants from Uzbekistan (70.4%, a difference of 0.23%), British West Indian (70.0%, a difference of 0.41%), Immigrants from Bangladesh (70.6%, a difference of 0.53%), Vietnamese (70.6%, a difference of 0.55%), and Immigrants from Barbados (69.7%, a difference of 0.75%).
| Demographics | Rating | Rank | In Labor Force | Age 20-24 |
| Dominicans | 0.0 /100 | #326 | Tragic 71.1% |
| Immigrants | Trinidad and Tobago | 0.0 /100 | #327 | Tragic 71.1% |
| Immigrants | China | 0.0 /100 | #328 | Tragic 71.1% |
| Yup'ik | 0.0 /100 | #329 | Tragic 70.9% |
| Vietnamese | 0.0 /100 | #330 | Tragic 70.6% |
| Immigrants | Bangladesh | 0.0 /100 | #331 | Tragic 70.6% |
| Immigrants | Uzbekistan | 0.0 /100 | #332 | Tragic 70.4% |
| Yuman | 0.0 /100 | #333 | Tragic 70.3% |
| British West Indians | 0.0 /100 | #334 | Tragic 70.0% |
| Immigrants | Barbados | 0.0 /100 | #335 | Tragic 69.7% |
| Immigrants | Guyana | 0.0 /100 | #336 | Tragic 69.3% |
| Guyanese | 0.0 /100 | #337 | Tragic 69.2% |
| Pima | 0.0 /100 | #338 | Tragic 69.0% |
| Immigrants | Yemen | 0.0 /100 | #339 | Tragic 68.9% |
| Menominee | 0.0 /100 | #340 | Tragic 68.7% |