Bahamian vs Iranian In Labor Force | Age 20-24
COMPARE
Bahamian
Iranian
In Labor Force | Age 20-24
In Labor Force | Age 20-24 Comparison
Bahamians
Iranians
73.3%
IN LABOR FORCE | AGE 20-24
0.1/ 100
METRIC RATING
280th/ 347
METRIC RANK
72.6%
IN LABOR FORCE | AGE 20-24
0.0/ 100
METRIC RATING
299th/ 347
METRIC RANK
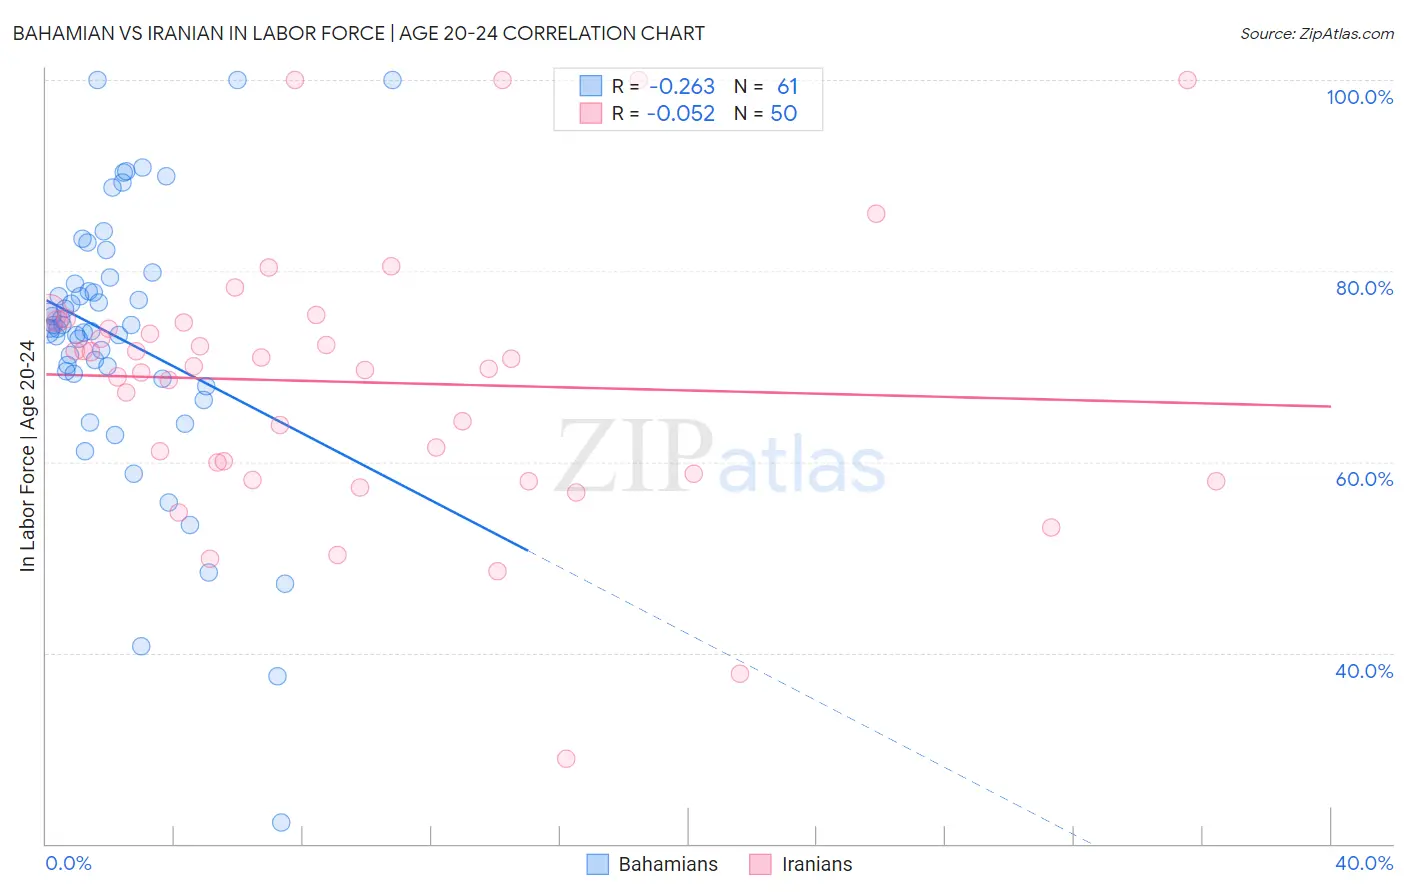
Bahamian vs Iranian In Labor Force | Age 20-24 Correlation Chart
The statistical analysis conducted on geographies consisting of 112,697,524 people shows a weak negative correlation between the proportion of Bahamians and labor force participation rate among population between the ages 20 and 24 in the United States with a correlation coefficient (R) of -0.263 and weighted average of 73.3%. Similarly, the statistical analysis conducted on geographies consisting of 316,816,770 people shows a slight negative correlation between the proportion of Iranians and labor force participation rate among population between the ages 20 and 24 in the United States with a correlation coefficient (R) of -0.052 and weighted average of 72.6%, a difference of 0.96%.
In Labor Force | Age 20-24 Correlation Summary
| Measurement | Bahamian | Iranian |
| Minimum | 22.2% | 28.9% |
| Maximum | 100.0% | 100.0% |
| Range | 77.8% | 71.1% |
| Mean | 72.9% | 68.4% |
| Median | 74.0% | 69.9% |
| Interquartile 25% (IQ1) | 69.0% | 58.8% |
| Interquartile 75% (IQ3) | 79.0% | 74.6% |
| Interquartile Range (IQR) | 10.0% | 15.8% |
| Standard Deviation (Sample) | 14.3% | 14.3% |
| Standard Deviation (Population) | 14.1% | 14.2% |
Demographics Similar to Bahamians and Iranians by In Labor Force | Age 20-24
In terms of in labor force | age 20-24, the demographic groups most similar to Bahamians are Immigrants from Venezuela (73.2%, a difference of 0.030%), Immigrants from Spain (73.2%, a difference of 0.040%), Immigrants from Bahamas (73.2%, a difference of 0.050%), Venezuelan (73.3%, a difference of 0.070%), and Kiowa (73.2%, a difference of 0.070%). Similarly, the demographic groups most similar to Iranians are Israeli (72.6%, a difference of 0.040%), Central American Indian (72.7%, a difference of 0.17%), Okinawan (72.7%, a difference of 0.22%), Jamaican (72.7%, a difference of 0.22%), and Immigrants from Argentina (72.8%, a difference of 0.33%).
| Demographics | Rating | Rank | In Labor Force | Age 20-24 |
| Venezuelans | 0.2 /100 | #279 | Tragic 73.3% |
| Bahamians | 0.1 /100 | #280 | Tragic 73.3% |
| Immigrants | Venezuela | 0.1 /100 | #281 | Tragic 73.2% |
| Immigrants | Spain | 0.1 /100 | #282 | Tragic 73.2% |
| Immigrants | Bahamas | 0.1 /100 | #283 | Tragic 73.2% |
| Kiowa | 0.1 /100 | #284 | Tragic 73.2% |
| Nicaraguans | 0.1 /100 | #285 | Tragic 73.2% |
| Immigrants | Lebanon | 0.1 /100 | #286 | Tragic 73.1% |
| Immigrants | Korea | 0.1 /100 | #287 | Tragic 73.1% |
| Argentineans | 0.1 /100 | #288 | Tragic 73.1% |
| U.S. Virgin Islanders | 0.1 /100 | #289 | Tragic 73.0% |
| Immigrants | Belarus | 0.1 /100 | #290 | Tragic 73.0% |
| Immigrants | Nicaragua | 0.0 /100 | #291 | Tragic 72.9% |
| Pueblo | 0.0 /100 | #292 | Tragic 72.9% |
| Immigrants | Belize | 0.0 /100 | #293 | Tragic 72.8% |
| Immigrants | Argentina | 0.0 /100 | #294 | Tragic 72.8% |
| Okinawans | 0.0 /100 | #295 | Tragic 72.7% |
| Jamaicans | 0.0 /100 | #296 | Tragic 72.7% |
| Central American Indians | 0.0 /100 | #297 | Tragic 72.7% |
| Israelis | 0.0 /100 | #298 | Tragic 72.6% |
| Iranians | 0.0 /100 | #299 | Tragic 72.6% |