Bahamian vs Korean In Labor Force | Age 20-24
COMPARE
Bahamian
Korean
In Labor Force | Age 20-24
In Labor Force | Age 20-24 Comparison
Bahamians
Koreans
73.3%
IN LABOR FORCE | AGE 20-24
0.1/ 100
METRIC RATING
280th/ 347
METRIC RANK
75.4%
IN LABOR FORCE | AGE 20-24
79.7/ 100
METRIC RATING
145th/ 347
METRIC RANK
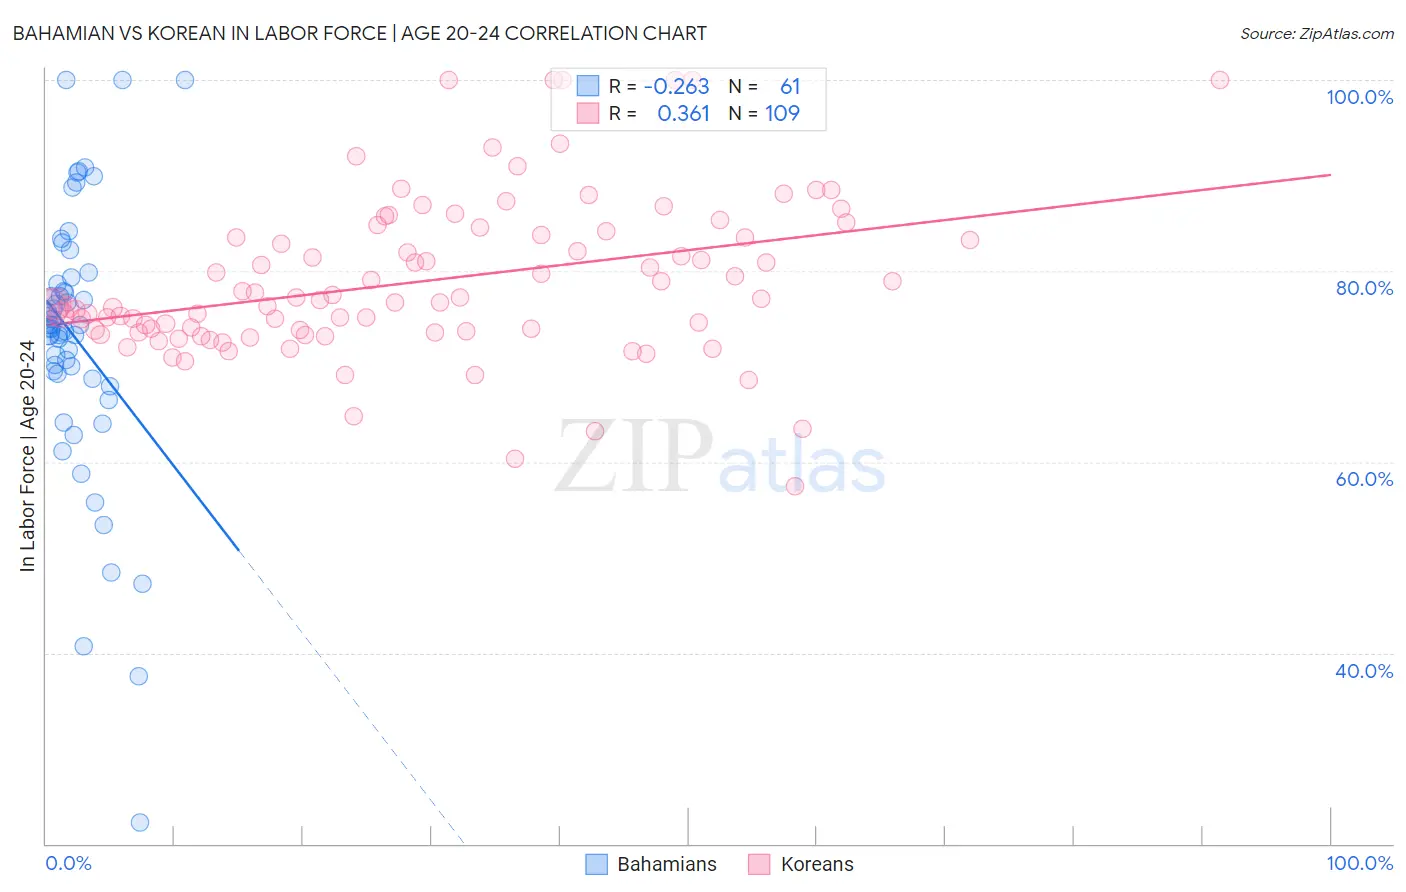
Bahamian vs Korean In Labor Force | Age 20-24 Correlation Chart
The statistical analysis conducted on geographies consisting of 112,697,524 people shows a weak negative correlation between the proportion of Bahamians and labor force participation rate among population between the ages 20 and 24 in the United States with a correlation coefficient (R) of -0.263 and weighted average of 73.3%. Similarly, the statistical analysis conducted on geographies consisting of 510,540,688 people shows a mild positive correlation between the proportion of Koreans and labor force participation rate among population between the ages 20 and 24 in the United States with a correlation coefficient (R) of 0.361 and weighted average of 75.4%, a difference of 3.0%.
In Labor Force | Age 20-24 Correlation Summary
| Measurement | Bahamian | Korean |
| Minimum | 22.2% | 57.4% |
| Maximum | 100.0% | 100.0% |
| Range | 77.8% | 42.6% |
| Mean | 72.9% | 79.0% |
| Median | 74.0% | 76.9% |
| Interquartile 25% (IQ1) | 69.0% | 73.6% |
| Interquartile 75% (IQ3) | 79.0% | 84.0% |
| Interquartile Range (IQR) | 10.0% | 10.3% |
| Standard Deviation (Sample) | 14.3% | 8.4% |
| Standard Deviation (Population) | 14.1% | 8.3% |
Similar Demographics by In Labor Force | Age 20-24
Demographics Similar to Bahamians by In Labor Force | Age 20-24
In terms of in labor force | age 20-24, the demographic groups most similar to Bahamians are Immigrants from Venezuela (73.2%, a difference of 0.030%), Immigrants from Spain (73.2%, a difference of 0.040%), Immigrants from Bahamas (73.2%, a difference of 0.050%), Venezuelan (73.3%, a difference of 0.070%), and Kiowa (73.2%, a difference of 0.070%).
| Demographics | Rating | Rank | In Labor Force | Age 20-24 |
| Cheyenne | 0.2 /100 | #273 | Tragic 73.4% |
| Immigrants | Colombia | 0.2 /100 | #274 | Tragic 73.4% |
| Immigrants | South America | 0.2 /100 | #275 | Tragic 73.3% |
| Mongolians | 0.2 /100 | #276 | Tragic 73.3% |
| Immigrants | Malaysia | 0.2 /100 | #277 | Tragic 73.3% |
| Cypriots | 0.2 /100 | #278 | Tragic 73.3% |
| Venezuelans | 0.2 /100 | #279 | Tragic 73.3% |
| Bahamians | 0.1 /100 | #280 | Tragic 73.3% |
| Immigrants | Venezuela | 0.1 /100 | #281 | Tragic 73.2% |
| Immigrants | Spain | 0.1 /100 | #282 | Tragic 73.2% |
| Immigrants | Bahamas | 0.1 /100 | #283 | Tragic 73.2% |
| Kiowa | 0.1 /100 | #284 | Tragic 73.2% |
| Nicaraguans | 0.1 /100 | #285 | Tragic 73.2% |
| Immigrants | Lebanon | 0.1 /100 | #286 | Tragic 73.1% |
| Immigrants | Korea | 0.1 /100 | #287 | Tragic 73.1% |
Demographics Similar to Koreans by In Labor Force | Age 20-24
In terms of in labor force | age 20-24, the demographic groups most similar to Koreans are Mexican American Indian (75.4%, a difference of 0.020%), Bhutanese (75.4%, a difference of 0.030%), Spaniard (75.5%, a difference of 0.050%), Comanche (75.4%, a difference of 0.050%), and Immigrants from Cambodia (75.4%, a difference of 0.060%).
| Demographics | Rating | Rank | In Labor Force | Age 20-24 |
| Australians | 84.8 /100 | #138 | Excellent 75.5% |
| Immigrants | England | 84.6 /100 | #139 | Excellent 75.5% |
| Delaware | 84.5 /100 | #140 | Excellent 75.5% |
| Romanians | 84.1 /100 | #141 | Excellent 75.5% |
| Blackfeet | 83.6 /100 | #142 | Excellent 75.5% |
| Spaniards | 82.0 /100 | #143 | Excellent 75.5% |
| Bhutanese | 80.8 /100 | #144 | Excellent 75.4% |
| Koreans | 79.7 /100 | #145 | Good 75.4% |
| Mexican American Indians | 78.8 /100 | #146 | Good 75.4% |
| Comanche | 77.6 /100 | #147 | Good 75.4% |
| Immigrants | Cambodia | 76.7 /100 | #148 | Good 75.4% |
| Ugandans | 76.1 /100 | #149 | Good 75.4% |
| Salvadorans | 74.8 /100 | #150 | Good 75.3% |
| Paiute | 74.1 /100 | #151 | Good 75.3% |
| Lebanese | 73.5 /100 | #152 | Good 75.3% |