Bahamian vs Carpatho Rusyn College, 1 year or more
COMPARE
Bahamian
Carpatho Rusyn
College, 1 year or more
College, 1 year or more Comparison
Bahamians
Carpatho Rusyns
54.5%
COLLEGE, 1 YEAR OR MORE
0.2/ 100
METRIC RATING
271st/ 347
METRIC RANK
62.2%
COLLEGE, 1 YEAR OR MORE
97.2/ 100
METRIC RATING
98th/ 347
METRIC RANK
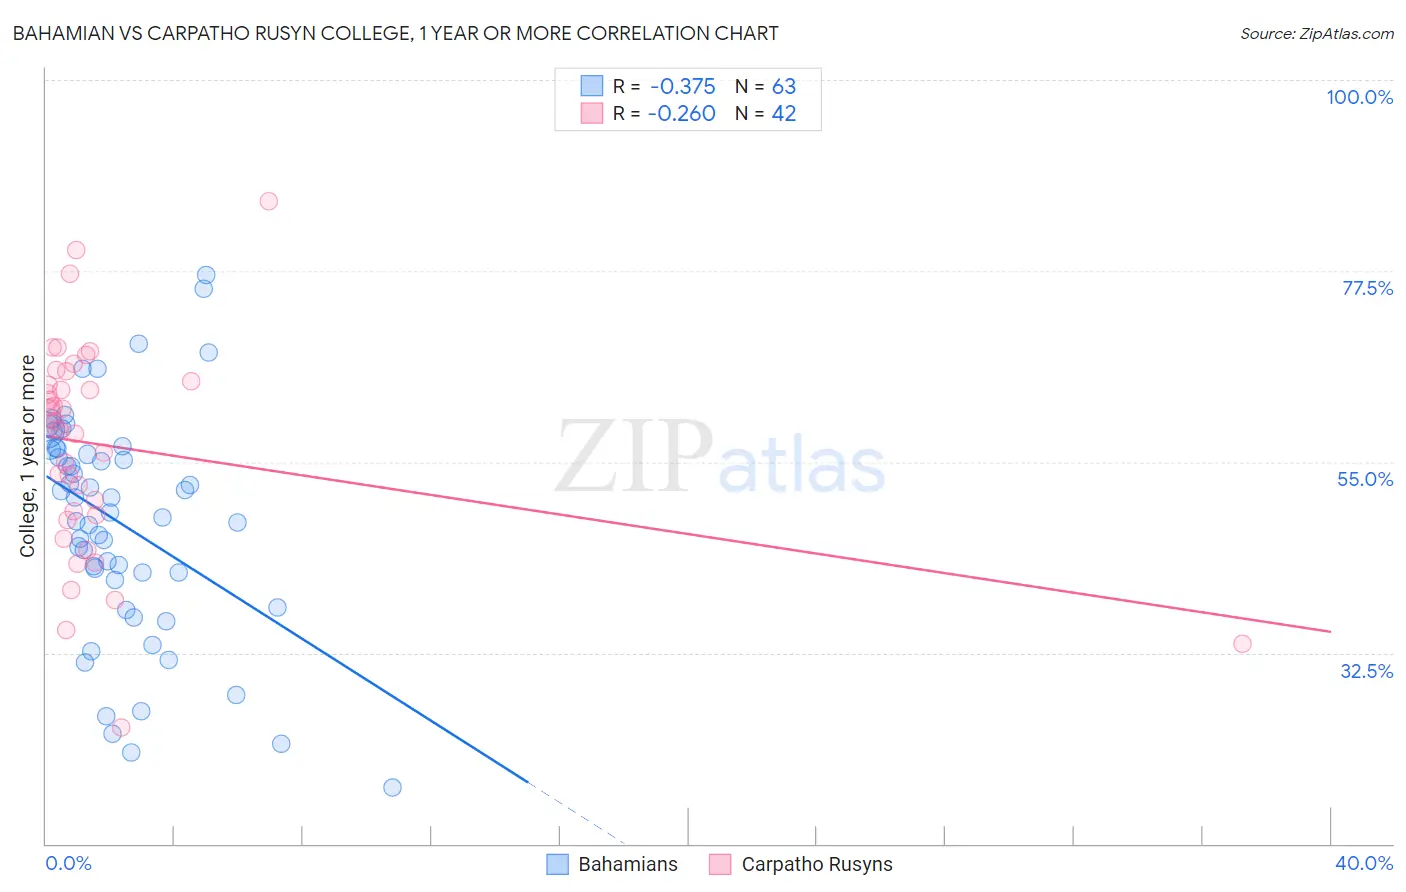
Bahamian vs Carpatho Rusyn College, 1 year or more Correlation Chart
The statistical analysis conducted on geographies consisting of 112,705,508 people shows a mild negative correlation between the proportion of Bahamians and percentage of population with at least college, 1 year or more education in the United States with a correlation coefficient (R) of -0.375 and weighted average of 54.5%. Similarly, the statistical analysis conducted on geographies consisting of 58,871,690 people shows a weak negative correlation between the proportion of Carpatho Rusyns and percentage of population with at least college, 1 year or more education in the United States with a correlation coefficient (R) of -0.260 and weighted average of 62.2%, a difference of 14.2%.
College, 1 year or more Correlation Summary
| Measurement | Bahamian | Carpatho Rusyn |
| Minimum | 16.6% | 23.7% |
| Maximum | 77.1% | 85.7% |
| Range | 60.4% | 62.1% |
| Mean | 47.8% | 56.9% |
| Median | 49.1% | 59.4% |
| Interquartile 25% (IQ1) | 41.0% | 48.8% |
| Interquartile 75% (IQ3) | 56.5% | 64.5% |
| Interquartile Range (IQR) | 15.5% | 15.6% |
| Standard Deviation (Sample) | 13.3% | 12.7% |
| Standard Deviation (Population) | 13.2% | 12.5% |
Similar Demographics by College, 1 year or more
Demographics Similar to Bahamians by College, 1 year or more
In terms of college, 1 year or more, the demographic groups most similar to Bahamians are Crow (54.5%, a difference of 0.020%), Comanche (54.4%, a difference of 0.050%), Bangladeshi (54.5%, a difference of 0.060%), Immigrants from Grenada (54.4%, a difference of 0.080%), and British West Indian (54.5%, a difference of 0.090%).
| Demographics | Rating | Rank | College, 1 year or more |
| Immigrants | Micronesia | 0.3 /100 | #264 | Tragic 54.8% |
| Immigrants | Laos | 0.2 /100 | #265 | Tragic 54.7% |
| Potawatomi | 0.2 /100 | #266 | Tragic 54.6% |
| Blackfeet | 0.2 /100 | #267 | Tragic 54.6% |
| British West Indians | 0.2 /100 | #268 | Tragic 54.5% |
| Bangladeshis | 0.2 /100 | #269 | Tragic 54.5% |
| Crow | 0.2 /100 | #270 | Tragic 54.5% |
| Bahamians | 0.2 /100 | #271 | Tragic 54.5% |
| Comanche | 0.2 /100 | #272 | Tragic 54.4% |
| Immigrants | Grenada | 0.2 /100 | #273 | Tragic 54.4% |
| Belizeans | 0.2 /100 | #274 | Tragic 54.4% |
| Americans | 0.2 /100 | #275 | Tragic 54.4% |
| Shoshone | 0.2 /100 | #276 | Tragic 54.3% |
| Ecuadorians | 0.2 /100 | #277 | Tragic 54.3% |
| Immigrants | Jamaica | 0.1 /100 | #278 | Tragic 54.2% |
Demographics Similar to Carpatho Rusyns by College, 1 year or more
In terms of college, 1 year or more, the demographic groups most similar to Carpatho Rusyns are Jordanian (62.2%, a difference of 0.0%), Croatian (62.2%, a difference of 0.0%), Chinese (62.2%, a difference of 0.010%), British (62.3%, a difference of 0.12%), and Icelander (62.1%, a difference of 0.17%).
| Demographics | Rating | Rank | College, 1 year or more |
| Immigrants | Eastern Europe | 97.8 /100 | #91 | Exceptional 62.4% |
| Immigrants | Egypt | 97.8 /100 | #92 | Exceptional 62.4% |
| Romanians | 97.7 /100 | #93 | Exceptional 62.4% |
| Immigrants | Croatia | 97.6 /100 | #94 | Exceptional 62.3% |
| British | 97.4 /100 | #95 | Exceptional 62.3% |
| Chinese | 97.2 /100 | #96 | Exceptional 62.2% |
| Jordanians | 97.2 /100 | #97 | Exceptional 62.2% |
| Carpatho Rusyns | 97.2 /100 | #98 | Exceptional 62.2% |
| Croatians | 97.1 /100 | #99 | Exceptional 62.2% |
| Icelanders | 96.8 /100 | #100 | Exceptional 62.1% |
| Swedes | 96.8 /100 | #101 | Exceptional 62.1% |
| Luxembourgers | 96.7 /100 | #102 | Exceptional 62.1% |
| Afghans | 96.4 /100 | #103 | Exceptional 62.0% |
| Chileans | 96.4 /100 | #104 | Exceptional 62.0% |
| Immigrants | Nepal | 96.3 /100 | #105 | Exceptional 62.0% |