Bahamian vs Immigrants from Poland In Labor Force | Age 20-24
COMPARE
Bahamian
Immigrants from Poland
In Labor Force | Age 20-24
In Labor Force | Age 20-24 Comparison
Bahamians
Immigrants from Poland
73.3%
IN LABOR FORCE | AGE 20-24
0.1/ 100
METRIC RATING
280th/ 347
METRIC RANK
76.1%
IN LABOR FORCE | AGE 20-24
97.7/ 100
METRIC RATING
101st/ 347
METRIC RANK
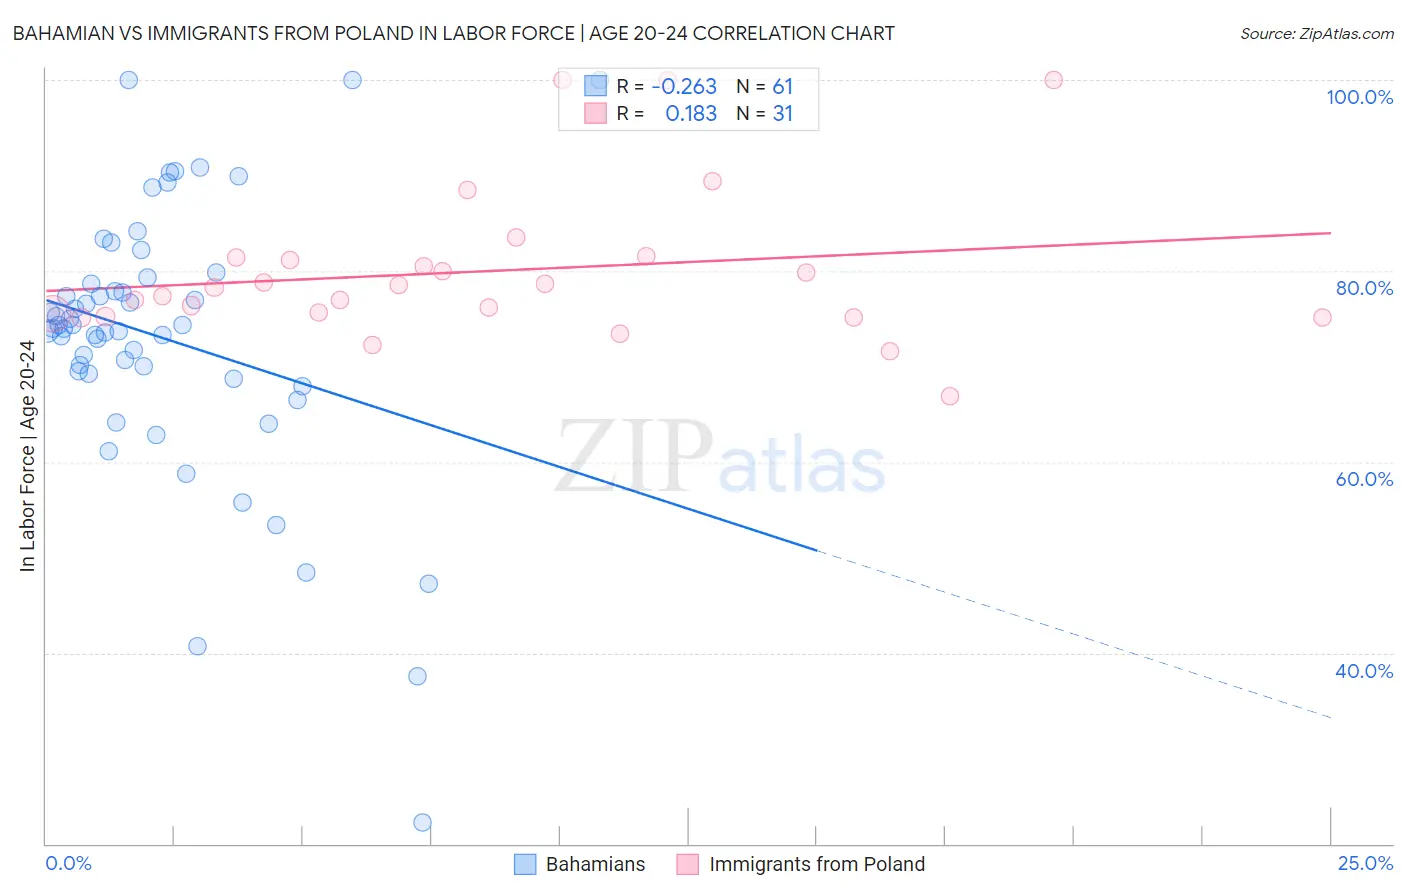
Bahamian vs Immigrants from Poland In Labor Force | Age 20-24 Correlation Chart
The statistical analysis conducted on geographies consisting of 112,697,524 people shows a weak negative correlation between the proportion of Bahamians and labor force participation rate among population between the ages 20 and 24 in the United States with a correlation coefficient (R) of -0.263 and weighted average of 73.3%. Similarly, the statistical analysis conducted on geographies consisting of 304,736,963 people shows a poor positive correlation between the proportion of Immigrants from Poland and labor force participation rate among population between the ages 20 and 24 in the United States with a correlation coefficient (R) of 0.183 and weighted average of 76.1%, a difference of 3.8%.
In Labor Force | Age 20-24 Correlation Summary
| Measurement | Bahamian | Immigrants from Poland |
| Minimum | 22.2% | 66.9% |
| Maximum | 100.0% | 100.0% |
| Range | 77.8% | 33.1% |
| Mean | 72.9% | 80.0% |
| Median | 74.0% | 78.2% |
| Interquartile 25% (IQ1) | 69.0% | 75.2% |
| Interquartile 75% (IQ3) | 79.0% | 81.5% |
| Interquartile Range (IQR) | 10.0% | 6.3% |
| Standard Deviation (Sample) | 14.3% | 8.0% |
| Standard Deviation (Population) | 14.1% | 7.9% |
Similar Demographics by In Labor Force | Age 20-24
Demographics Similar to Bahamians by In Labor Force | Age 20-24
In terms of in labor force | age 20-24, the demographic groups most similar to Bahamians are Immigrants from Venezuela (73.2%, a difference of 0.030%), Immigrants from Spain (73.2%, a difference of 0.040%), Immigrants from Bahamas (73.2%, a difference of 0.050%), Venezuelan (73.3%, a difference of 0.070%), and Kiowa (73.2%, a difference of 0.070%).
| Demographics | Rating | Rank | In Labor Force | Age 20-24 |
| Cheyenne | 0.2 /100 | #273 | Tragic 73.4% |
| Immigrants | Colombia | 0.2 /100 | #274 | Tragic 73.4% |
| Immigrants | South America | 0.2 /100 | #275 | Tragic 73.3% |
| Mongolians | 0.2 /100 | #276 | Tragic 73.3% |
| Immigrants | Malaysia | 0.2 /100 | #277 | Tragic 73.3% |
| Cypriots | 0.2 /100 | #278 | Tragic 73.3% |
| Venezuelans | 0.2 /100 | #279 | Tragic 73.3% |
| Bahamians | 0.1 /100 | #280 | Tragic 73.3% |
| Immigrants | Venezuela | 0.1 /100 | #281 | Tragic 73.2% |
| Immigrants | Spain | 0.1 /100 | #282 | Tragic 73.2% |
| Immigrants | Bahamas | 0.1 /100 | #283 | Tragic 73.2% |
| Kiowa | 0.1 /100 | #284 | Tragic 73.2% |
| Nicaraguans | 0.1 /100 | #285 | Tragic 73.2% |
| Immigrants | Lebanon | 0.1 /100 | #286 | Tragic 73.1% |
| Immigrants | Korea | 0.1 /100 | #287 | Tragic 73.1% |
Demographics Similar to Immigrants from Poland by In Labor Force | Age 20-24
In terms of in labor force | age 20-24, the demographic groups most similar to Immigrants from Poland are Latvian (76.1%, a difference of 0.010%), American (76.1%, a difference of 0.020%), Shoshone (76.1%, a difference of 0.020%), Immigrants from North Macedonia (76.1%, a difference of 0.030%), and Immigrants from Lithuania (76.1%, a difference of 0.050%).
| Demographics | Rating | Rank | In Labor Force | Age 20-24 |
| Potawatomi | 98.5 /100 | #94 | Exceptional 76.2% |
| Immigrants | Germany | 98.5 /100 | #95 | Exceptional 76.2% |
| Immigrants | Nonimmigrants | 98.5 /100 | #96 | Exceptional 76.2% |
| Immigrants | Lithuania | 98.0 /100 | #97 | Exceptional 76.1% |
| Immigrants | Oceania | 98.0 /100 | #98 | Exceptional 76.1% |
| Americans | 97.8 /100 | #99 | Exceptional 76.1% |
| Shoshone | 97.8 /100 | #100 | Exceptional 76.1% |
| Immigrants | Poland | 97.7 /100 | #101 | Exceptional 76.1% |
| Latvians | 97.6 /100 | #102 | Exceptional 76.1% |
| Immigrants | North Macedonia | 97.5 /100 | #103 | Exceptional 76.1% |
| Macedonians | 97.2 /100 | #104 | Exceptional 76.0% |
| Immigrants | Nepal | 97.2 /100 | #105 | Exceptional 76.0% |
| Immigrants | Uganda | 97.1 /100 | #106 | Exceptional 76.0% |
| Greeks | 96.9 /100 | #107 | Exceptional 76.0% |
| Iraqis | 96.6 /100 | #108 | Exceptional 76.0% |