Immigrants from Malaysia vs Immigrants from Middle Africa In Labor Force | Age 20-64
COMPARE
Immigrants from Malaysia
Immigrants from Middle Africa
In Labor Force | Age 20-64
In Labor Force | Age 20-64 Comparison
Immigrants from Malaysia
Immigrants from Middle Africa
80.1%
IN LABOR FORCE | AGE 20-64
95.9/ 100
METRIC RATING
96th/ 347
METRIC RANK
80.5%
IN LABOR FORCE | AGE 20-64
99.7/ 100
METRIC RATING
44th/ 347
METRIC RANK
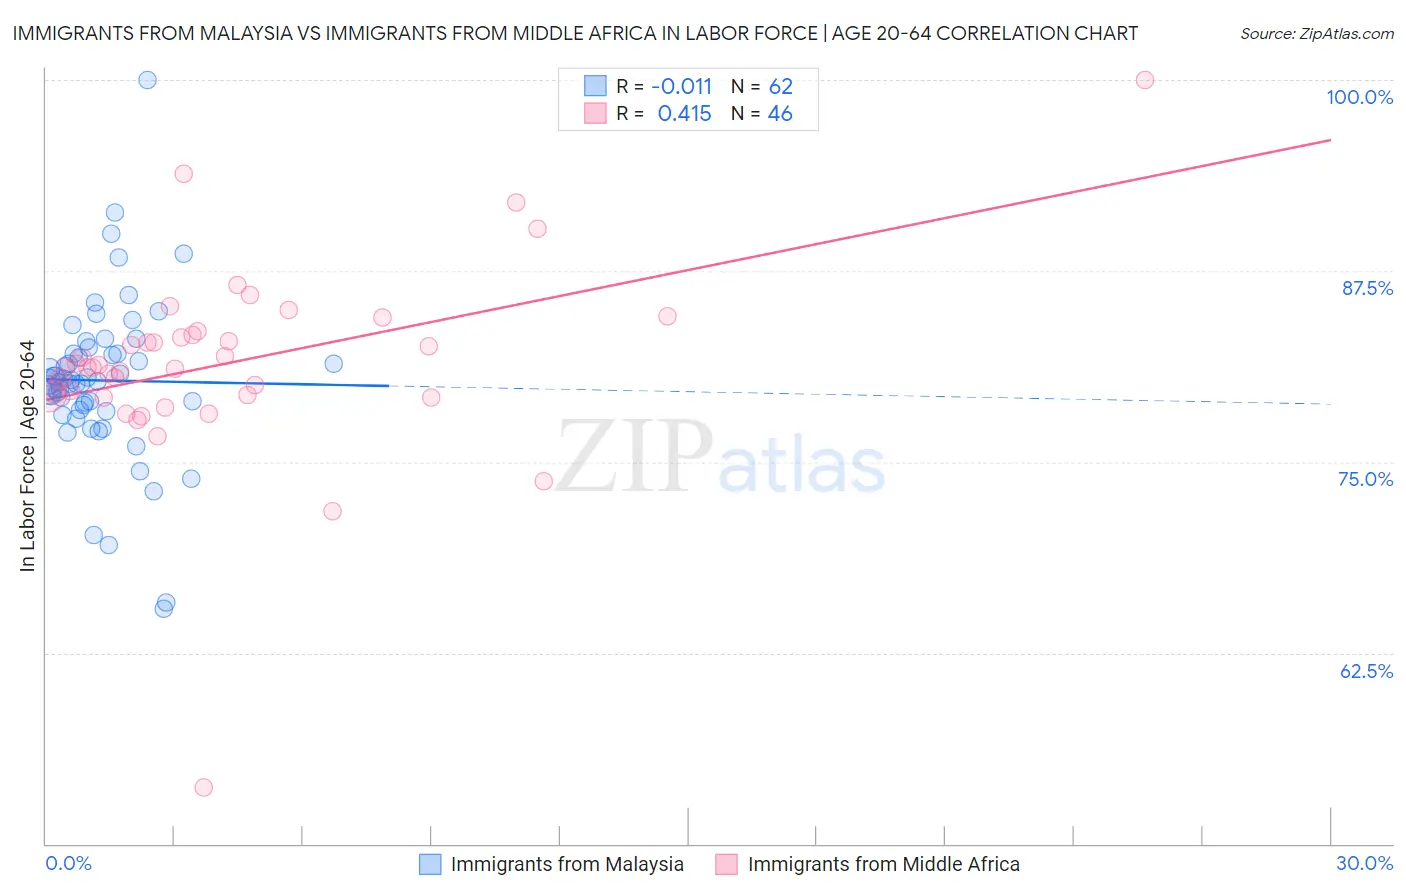
Immigrants from Malaysia vs Immigrants from Middle Africa In Labor Force | Age 20-64 Correlation Chart
The statistical analysis conducted on geographies consisting of 197,972,678 people shows no correlation between the proportion of Immigrants from Malaysia and labor force participation rate among population between the ages 20 and 64 in the United States with a correlation coefficient (R) of -0.011 and weighted average of 80.1%. Similarly, the statistical analysis conducted on geographies consisting of 202,739,694 people shows a moderate positive correlation between the proportion of Immigrants from Middle Africa and labor force participation rate among population between the ages 20 and 64 in the United States with a correlation coefficient (R) of 0.415 and weighted average of 80.5%, a difference of 0.53%.
In Labor Force | Age 20-64 Correlation Summary
| Measurement | Immigrants from Malaysia | Immigrants from Middle Africa |
| Minimum | 65.4% | 53.7% |
| Maximum | 100.0% | 100.0% |
| Range | 34.6% | 46.3% |
| Mean | 80.3% | 81.5% |
| Median | 80.3% | 81.2% |
| Interquartile 25% (IQ1) | 78.4% | 79.4% |
| Interquartile 75% (IQ3) | 82.1% | 83.3% |
| Interquartile Range (IQR) | 3.7% | 3.9% |
| Standard Deviation (Sample) | 5.4% | 6.4% |
| Standard Deviation (Population) | 5.4% | 6.3% |
Similar Demographics by In Labor Force | Age 20-64
Demographics Similar to Immigrants from Malaysia by In Labor Force | Age 20-64
In terms of in labor force | age 20-64, the demographic groups most similar to Immigrants from Malaysia are Yugoslavian (80.1%, a difference of 0.0%), South American (80.1%, a difference of 0.0%), Immigrants from Uruguay (80.1%, a difference of 0.0%), Immigrants from Asia (80.1%, a difference of 0.010%), and Immigrants from Chile (80.1%, a difference of 0.010%).
| Demographics | Rating | Rank | In Labor Force | Age 20-64 |
| Immigrants | Venezuela | 96.8 /100 | #89 | Exceptional 80.1% |
| Poles | 96.8 /100 | #90 | Exceptional 80.1% |
| Uruguayans | 96.7 /100 | #91 | Exceptional 80.1% |
| Ghanaians | 96.7 /100 | #92 | Exceptional 80.1% |
| Immigrants | Belarus | 96.4 /100 | #93 | Exceptional 80.1% |
| Immigrants | Asia | 96.0 /100 | #94 | Exceptional 80.1% |
| Yugoslavians | 95.9 /100 | #95 | Exceptional 80.1% |
| Immigrants | Malaysia | 95.9 /100 | #96 | Exceptional 80.1% |
| South Americans | 95.9 /100 | #97 | Exceptional 80.1% |
| Immigrants | Uruguay | 95.8 /100 | #98 | Exceptional 80.1% |
| Immigrants | Chile | 95.7 /100 | #99 | Exceptional 80.1% |
| Filipinos | 95.6 /100 | #100 | Exceptional 80.1% |
| Palestinians | 95.5 /100 | #101 | Exceptional 80.0% |
| Immigrants | Australia | 95.5 /100 | #102 | Exceptional 80.0% |
| Russians | 95.5 /100 | #103 | Exceptional 80.0% |
Demographics Similar to Immigrants from Middle Africa by In Labor Force | Age 20-64
In terms of in labor force | age 20-64, the demographic groups most similar to Immigrants from Middle Africa are Slovene (80.5%, a difference of 0.020%), Czech (80.5%, a difference of 0.030%), Immigrants from Pakistan (80.5%, a difference of 0.030%), Latvian (80.5%, a difference of 0.040%), and Immigrants from Liberia (80.5%, a difference of 0.060%).
| Demographics | Rating | Rank | In Labor Force | Age 20-64 |
| Immigrants | Moldova | 99.8 /100 | #37 | Exceptional 80.6% |
| Ugandans | 99.8 /100 | #38 | Exceptional 80.6% |
| Brazilians | 99.8 /100 | #39 | Exceptional 80.5% |
| Immigrants | Zimbabwe | 99.8 /100 | #40 | Exceptional 80.5% |
| Immigrants | Liberia | 99.8 /100 | #41 | Exceptional 80.5% |
| Latvians | 99.8 /100 | #42 | Exceptional 80.5% |
| Czechs | 99.7 /100 | #43 | Exceptional 80.5% |
| Immigrants | Middle Africa | 99.7 /100 | #44 | Exceptional 80.5% |
| Slovenes | 99.7 /100 | #45 | Exceptional 80.5% |
| Immigrants | Pakistan | 99.6 /100 | #46 | Exceptional 80.5% |
| Immigrants | Africa | 99.6 /100 | #47 | Exceptional 80.4% |
| Immigrants | Hong Kong | 99.5 /100 | #48 | Exceptional 80.4% |
| Immigrants | Greece | 99.4 /100 | #49 | Exceptional 80.4% |
| Immigrants | Sudan | 99.4 /100 | #50 | Exceptional 80.4% |
| Immigrants | Sri Lanka | 99.3 /100 | #51 | Exceptional 80.4% |