Soviet Union vs Immigrants from Middle Africa In Labor Force | Age 20-64
COMPARE
Soviet Union
Immigrants from Middle Africa
In Labor Force | Age 20-64
In Labor Force | Age 20-64 Comparison
Soviet Union
Immigrants from Middle Africa
80.2%
IN LABOR FORCE | AGE 20-64
98.5/ 100
METRIC RATING
71st/ 347
METRIC RANK
80.5%
IN LABOR FORCE | AGE 20-64
99.7/ 100
METRIC RATING
44th/ 347
METRIC RANK
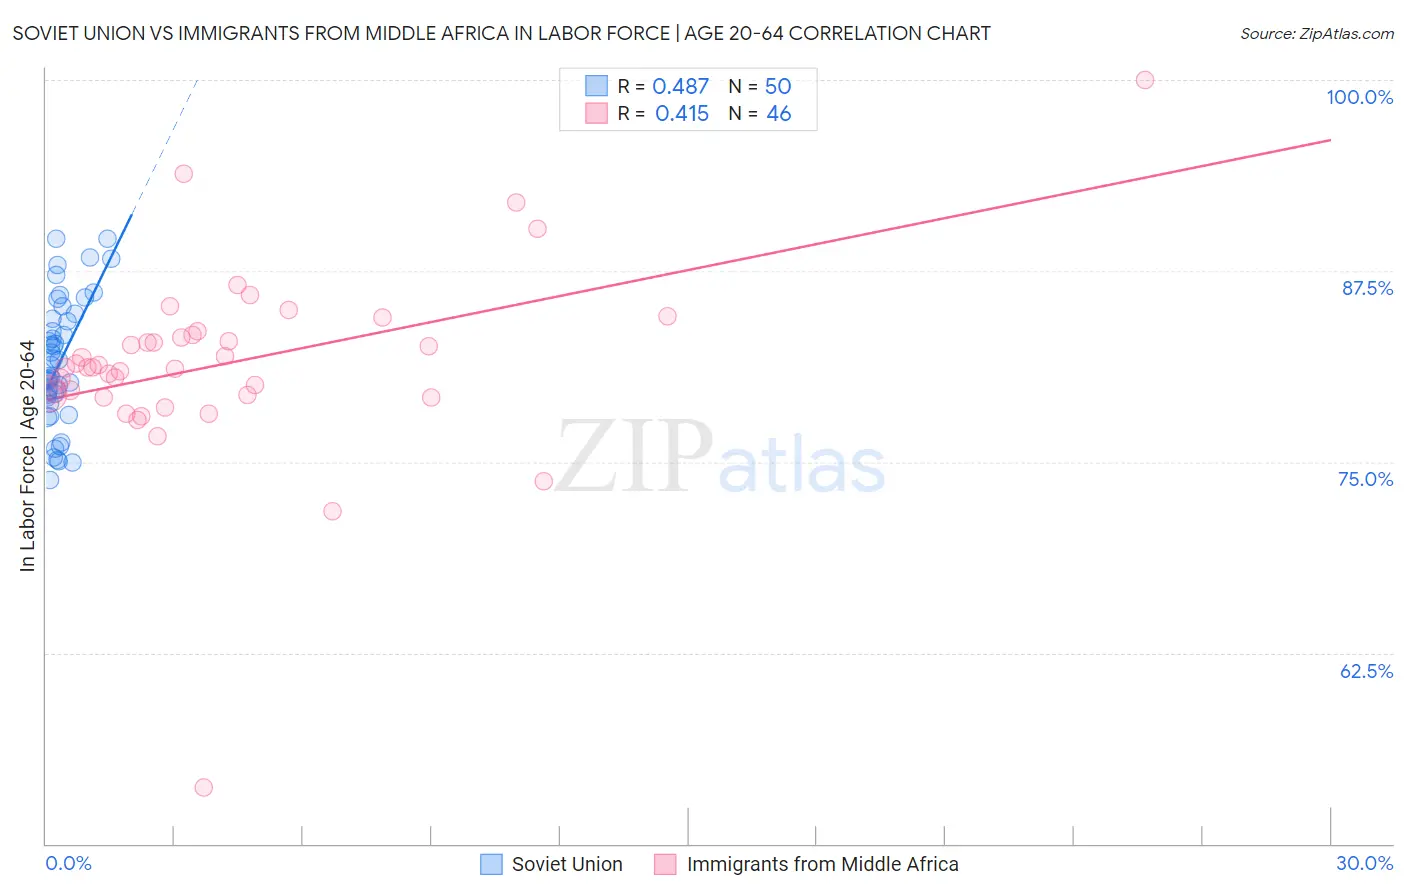
Soviet Union vs Immigrants from Middle Africa In Labor Force | Age 20-64 Correlation Chart
The statistical analysis conducted on geographies consisting of 43,514,626 people shows a moderate positive correlation between the proportion of Soviet Union and labor force participation rate among population between the ages 20 and 64 in the United States with a correlation coefficient (R) of 0.487 and weighted average of 80.2%. Similarly, the statistical analysis conducted on geographies consisting of 202,739,694 people shows a moderate positive correlation between the proportion of Immigrants from Middle Africa and labor force participation rate among population between the ages 20 and 64 in the United States with a correlation coefficient (R) of 0.415 and weighted average of 80.5%, a difference of 0.32%.
In Labor Force | Age 20-64 Correlation Summary
| Measurement | Soviet Union | Immigrants from Middle Africa |
| Minimum | 73.8% | 53.7% |
| Maximum | 89.6% | 100.0% |
| Range | 15.8% | 46.3% |
| Mean | 81.5% | 81.5% |
| Median | 81.0% | 81.2% |
| Interquartile 25% (IQ1) | 79.2% | 79.4% |
| Interquartile 75% (IQ3) | 84.3% | 83.3% |
| Interquartile Range (IQR) | 5.1% | 3.9% |
| Standard Deviation (Sample) | 4.1% | 6.4% |
| Standard Deviation (Population) | 4.1% | 6.3% |
Similar Demographics by In Labor Force | Age 20-64
Demographics Similar to Soviet Union by In Labor Force | Age 20-64
In terms of in labor force | age 20-64, the demographic groups most similar to Soviet Union are Bhutanese (80.2%, a difference of 0.010%), Albanian (80.2%, a difference of 0.010%), Immigrants from Turkey (80.2%, a difference of 0.010%), Eastern European (80.2%, a difference of 0.010%), and Macedonian (80.2%, a difference of 0.020%).
| Demographics | Rating | Rank | In Labor Force | Age 20-64 |
| Immigrants | Albania | 98.7 /100 | #64 | Exceptional 80.3% |
| Lithuanians | 98.7 /100 | #65 | Exceptional 80.2% |
| Macedonians | 98.7 /100 | #66 | Exceptional 80.2% |
| Taiwanese | 98.6 /100 | #67 | Exceptional 80.2% |
| Bhutanese | 98.6 /100 | #68 | Exceptional 80.2% |
| Albanians | 98.6 /100 | #69 | Exceptional 80.2% |
| Immigrants | Turkey | 98.5 /100 | #70 | Exceptional 80.2% |
| Soviet Union | 98.5 /100 | #71 | Exceptional 80.2% |
| Eastern Europeans | 98.4 /100 | #72 | Exceptional 80.2% |
| Cypriots | 98.2 /100 | #73 | Exceptional 80.2% |
| Immigrants | Eastern Europe | 98.1 /100 | #74 | Exceptional 80.2% |
| Immigrants | Afghanistan | 97.9 /100 | #75 | Exceptional 80.2% |
| Egyptians | 97.8 /100 | #76 | Exceptional 80.2% |
| Immigrants | Colombia | 97.8 /100 | #77 | Exceptional 80.2% |
| Immigrants | Romania | 97.8 /100 | #78 | Exceptional 80.2% |
Demographics Similar to Immigrants from Middle Africa by In Labor Force | Age 20-64
In terms of in labor force | age 20-64, the demographic groups most similar to Immigrants from Middle Africa are Slovene (80.5%, a difference of 0.020%), Czech (80.5%, a difference of 0.030%), Immigrants from Pakistan (80.5%, a difference of 0.030%), Latvian (80.5%, a difference of 0.040%), and Immigrants from Liberia (80.5%, a difference of 0.060%).
| Demographics | Rating | Rank | In Labor Force | Age 20-64 |
| Immigrants | Moldova | 99.8 /100 | #37 | Exceptional 80.6% |
| Ugandans | 99.8 /100 | #38 | Exceptional 80.6% |
| Brazilians | 99.8 /100 | #39 | Exceptional 80.5% |
| Immigrants | Zimbabwe | 99.8 /100 | #40 | Exceptional 80.5% |
| Immigrants | Liberia | 99.8 /100 | #41 | Exceptional 80.5% |
| Latvians | 99.8 /100 | #42 | Exceptional 80.5% |
| Czechs | 99.7 /100 | #43 | Exceptional 80.5% |
| Immigrants | Middle Africa | 99.7 /100 | #44 | Exceptional 80.5% |
| Slovenes | 99.7 /100 | #45 | Exceptional 80.5% |
| Immigrants | Pakistan | 99.6 /100 | #46 | Exceptional 80.5% |
| Immigrants | Africa | 99.6 /100 | #47 | Exceptional 80.4% |
| Immigrants | Hong Kong | 99.5 /100 | #48 | Exceptional 80.4% |
| Immigrants | Greece | 99.4 /100 | #49 | Exceptional 80.4% |
| Immigrants | Sudan | 99.4 /100 | #50 | Exceptional 80.4% |
| Immigrants | Sri Lanka | 99.3 /100 | #51 | Exceptional 80.4% |