Ukrainian vs Bermudan In Labor Force | Age 20-64
COMPARE
Ukrainian
Bermudan
In Labor Force | Age 20-64
In Labor Force | Age 20-64 Comparison
Ukrainians
Bermudans
79.9%
IN LABOR FORCE | AGE 20-64
86.8/ 100
METRIC RATING
135th/ 347
METRIC RANK
80.0%
IN LABOR FORCE | AGE 20-64
93.3/ 100
METRIC RATING
115th/ 347
METRIC RANK
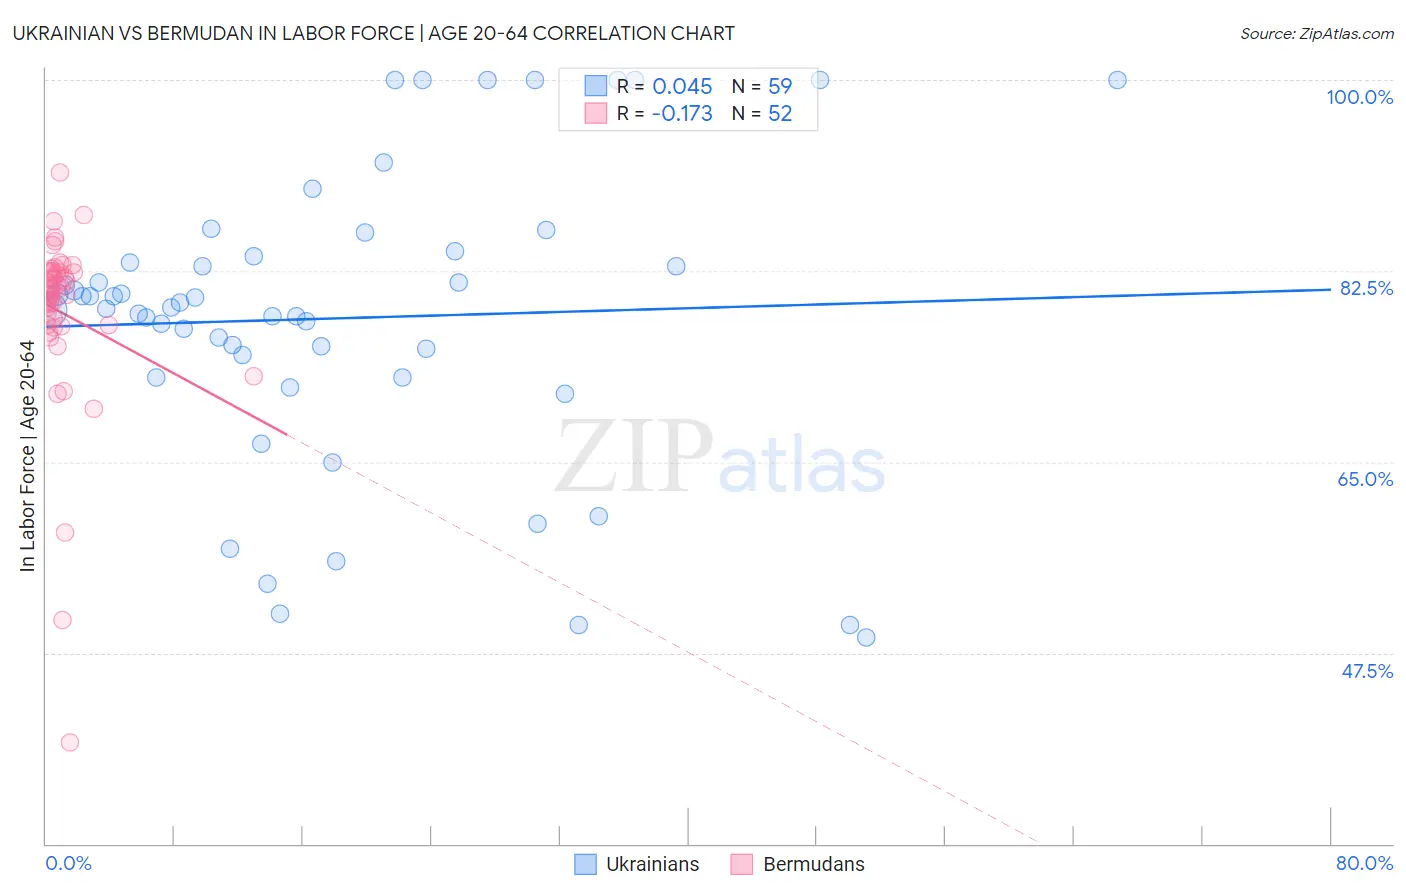
Ukrainian vs Bermudan In Labor Force | Age 20-64 Correlation Chart
The statistical analysis conducted on geographies consisting of 448,709,826 people shows no correlation between the proportion of Ukrainians and labor force participation rate among population between the ages 20 and 64 in the United States with a correlation coefficient (R) of 0.045 and weighted average of 79.9%. Similarly, the statistical analysis conducted on geographies consisting of 55,730,379 people shows a poor negative correlation between the proportion of Bermudans and labor force participation rate among population between the ages 20 and 64 in the United States with a correlation coefficient (R) of -0.173 and weighted average of 80.0%, a difference of 0.15%.
In Labor Force | Age 20-64 Correlation Summary
| Measurement | Ukrainian | Bermudan |
| Minimum | 48.9% | 39.3% |
| Maximum | 100.0% | 91.5% |
| Range | 51.1% | 52.2% |
| Mean | 78.2% | 78.7% |
| Median | 79.2% | 80.7% |
| Interquartile 25% (IQ1) | 72.8% | 77.5% |
| Interquartile 75% (IQ3) | 83.8% | 82.4% |
| Interquartile Range (IQR) | 11.0% | 4.9% |
| Standard Deviation (Sample) | 13.4% | 8.5% |
| Standard Deviation (Population) | 13.3% | 8.4% |
Demographics Similar to Ukrainians and Bermudans by In Labor Force | Age 20-64
In terms of in labor force | age 20-64, the demographic groups most similar to Ukrainians are South American Indian (79.9%, a difference of 0.010%), Belgian (79.9%, a difference of 0.010%), Indian (Asian) (79.9%, a difference of 0.020%), Immigrants from Zaire (79.9%, a difference of 0.030%), and Immigrants from Iran (79.9%, a difference of 0.030%). Similarly, the demographic groups most similar to Bermudans are Immigrants from Western Africa (80.0%, a difference of 0.010%), Immigrants from Vietnam (80.0%, a difference of 0.020%), Cape Verdean (80.0%, a difference of 0.020%), Immigrants from Taiwan (80.0%, a difference of 0.030%), and Maltese (80.0%, a difference of 0.030%).
| Demographics | Rating | Rank | In Labor Force | Age 20-64 |
| Bermudans | 93.3 /100 | #115 | Exceptional 80.0% |
| Immigrants | Western Africa | 93.1 /100 | #116 | Exceptional 80.0% |
| Immigrants | Vietnam | 92.7 /100 | #117 | Exceptional 80.0% |
| Cape Verdeans | 92.7 /100 | #118 | Exceptional 80.0% |
| Immigrants | Taiwan | 92.5 /100 | #119 | Exceptional 80.0% |
| Maltese | 92.4 /100 | #120 | Exceptional 80.0% |
| Immigrants | Kuwait | 92.2 /100 | #121 | Exceptional 80.0% |
| Mongolians | 92.0 /100 | #122 | Exceptional 79.9% |
| Immigrants | Russia | 91.8 /100 | #123 | Exceptional 79.9% |
| Immigrants | Europe | 91.6 /100 | #124 | Exceptional 79.9% |
| Danes | 91.5 /100 | #125 | Exceptional 79.9% |
| Immigrants | France | 90.7 /100 | #126 | Exceptional 79.9% |
| Immigrants | Czechoslovakia | 89.7 /100 | #127 | Excellent 79.9% |
| Immigrants | Eastern Asia | 89.4 /100 | #128 | Excellent 79.9% |
| Italians | 88.9 /100 | #129 | Excellent 79.9% |
| Immigrants | Zaire | 88.6 /100 | #130 | Excellent 79.9% |
| Immigrants | Iran | 88.3 /100 | #131 | Excellent 79.9% |
| Indians (Asian) | 87.7 /100 | #132 | Excellent 79.9% |
| South American Indians | 87.6 /100 | #133 | Excellent 79.9% |
| Belgians | 87.4 /100 | #134 | Excellent 79.9% |
| Ukrainians | 86.8 /100 | #135 | Excellent 79.9% |