Indonesian vs Bermudan In Labor Force | Age 20-64
COMPARE
Indonesian
Bermudan
In Labor Force | Age 20-64
In Labor Force | Age 20-64 Comparison
Indonesians
Bermudans
79.4%
IN LABOR FORCE | AGE 20-64
26.1/ 100
METRIC RATING
193rd/ 347
METRIC RANK
80.0%
IN LABOR FORCE | AGE 20-64
93.3/ 100
METRIC RATING
115th/ 347
METRIC RANK
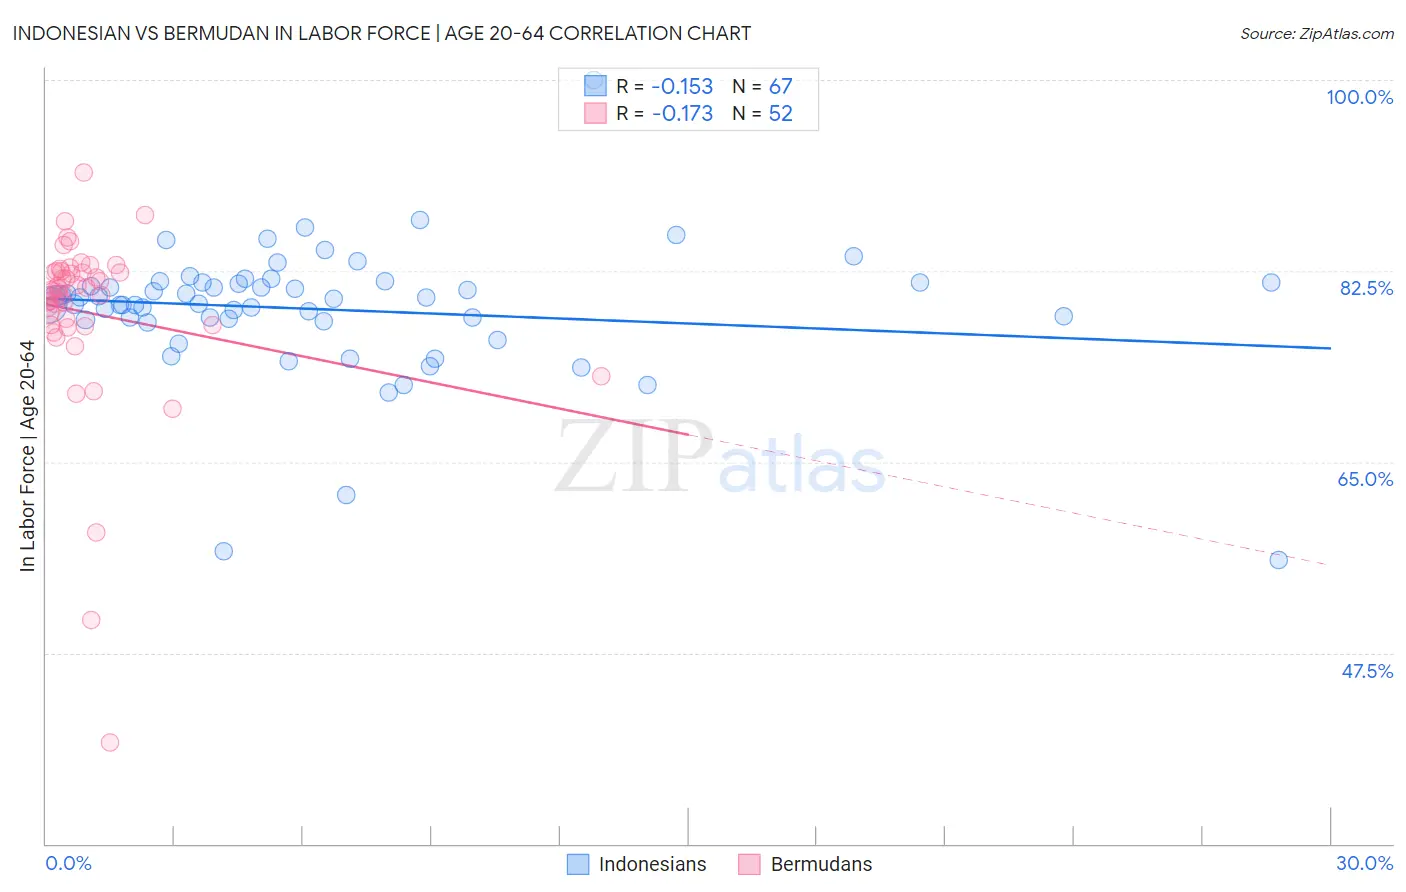
Indonesian vs Bermudan In Labor Force | Age 20-64 Correlation Chart
The statistical analysis conducted on geographies consisting of 162,740,324 people shows a poor negative correlation between the proportion of Indonesians and labor force participation rate among population between the ages 20 and 64 in the United States with a correlation coefficient (R) of -0.153 and weighted average of 79.4%. Similarly, the statistical analysis conducted on geographies consisting of 55,730,379 people shows a poor negative correlation between the proportion of Bermudans and labor force participation rate among population between the ages 20 and 64 in the United States with a correlation coefficient (R) of -0.173 and weighted average of 80.0%, a difference of 0.74%.
In Labor Force | Age 20-64 Correlation Summary
| Measurement | Indonesian | Bermudan |
| Minimum | 56.0% | 39.3% |
| Maximum | 100.0% | 91.5% |
| Range | 44.0% | 52.2% |
| Mean | 79.0% | 78.7% |
| Median | 80.0% | 80.7% |
| Interquartile 25% (IQ1) | 78.1% | 77.5% |
| Interquartile 75% (IQ3) | 81.4% | 82.4% |
| Interquartile Range (IQR) | 3.3% | 4.9% |
| Standard Deviation (Sample) | 6.2% | 8.5% |
| Standard Deviation (Population) | 6.1% | 8.4% |
Similar Demographics by In Labor Force | Age 20-64
Demographics Similar to Indonesians by In Labor Force | Age 20-64
In terms of in labor force | age 20-64, the demographic groups most similar to Indonesians are Immigrants from Denmark (79.4%, a difference of 0.010%), Immigrants from Thailand (79.4%, a difference of 0.010%), Swiss (79.4%, a difference of 0.030%), Immigrants from Austria (79.4%, a difference of 0.030%), and Ecuadorian (79.4%, a difference of 0.030%).
| Demographics | Rating | Rank | In Labor Force | Age 20-64 |
| Northern Europeans | 34.5 /100 | #186 | Fair 79.5% |
| Assyrians/Chaldeans/Syriacs | 33.3 /100 | #187 | Fair 79.4% |
| Immigrants | Haiti | 32.1 /100 | #188 | Fair 79.4% |
| Immigrants | El Salvador | 30.9 /100 | #189 | Fair 79.4% |
| Immigrants | Syria | 30.8 /100 | #190 | Fair 79.4% |
| Swiss | 28.9 /100 | #191 | Fair 79.4% |
| Immigrants | Denmark | 26.9 /100 | #192 | Fair 79.4% |
| Indonesians | 26.1 /100 | #193 | Fair 79.4% |
| Immigrants | Thailand | 24.8 /100 | #194 | Fair 79.4% |
| Immigrants | Austria | 23.7 /100 | #195 | Fair 79.4% |
| Ecuadorians | 23.1 /100 | #196 | Fair 79.4% |
| Immigrants | Senegal | 22.5 /100 | #197 | Fair 79.4% |
| Immigrants | Laos | 21.5 /100 | #198 | Fair 79.4% |
| Dutch | 20.2 /100 | #199 | Fair 79.3% |
| Immigrants | Oceania | 19.1 /100 | #200 | Poor 79.3% |
Demographics Similar to Bermudans by In Labor Force | Age 20-64
In terms of in labor force | age 20-64, the demographic groups most similar to Bermudans are Immigrants from Western Africa (80.0%, a difference of 0.010%), Estonian (80.0%, a difference of 0.020%), Immigrants from South America (80.0%, a difference of 0.020%), Immigrants from Italy (80.0%, a difference of 0.020%), and Sri Lankan (80.0%, a difference of 0.020%).
| Demographics | Rating | Rank | In Labor Force | Age 20-64 |
| Iranians | 94.3 /100 | #108 | Exceptional 80.0% |
| Immigrants | Argentina | 94.1 /100 | #109 | Exceptional 80.0% |
| Estonians | 94.0 /100 | #110 | Exceptional 80.0% |
| Immigrants | South America | 93.9 /100 | #111 | Exceptional 80.0% |
| Immigrants | Italy | 93.9 /100 | #112 | Exceptional 80.0% |
| Sri Lankans | 93.9 /100 | #113 | Exceptional 80.0% |
| Argentineans | 93.8 /100 | #114 | Exceptional 80.0% |
| Bermudans | 93.3 /100 | #115 | Exceptional 80.0% |
| Immigrants | Western Africa | 93.1 /100 | #116 | Exceptional 80.0% |
| Immigrants | Vietnam | 92.7 /100 | #117 | Exceptional 80.0% |
| Cape Verdeans | 92.7 /100 | #118 | Exceptional 80.0% |
| Immigrants | Taiwan | 92.5 /100 | #119 | Exceptional 80.0% |
| Maltese | 92.4 /100 | #120 | Exceptional 80.0% |
| Immigrants | Kuwait | 92.2 /100 | #121 | Exceptional 80.0% |
| Mongolians | 92.0 /100 | #122 | Exceptional 79.9% |