Armenian vs Iroquois In Labor Force | Age > 16
COMPARE
Armenian
Iroquois
In Labor Force | Age > 16
In Labor Force | Age > 16 Comparison
Armenians
Iroquois
64.9%
IN LABOR FORCE | AGE > 16
20.2/ 100
METRIC RATING
200th/ 347
METRIC RANK
63.2%
IN LABOR FORCE | AGE > 16
0.0/ 100
METRIC RATING
312th/ 347
METRIC RANK
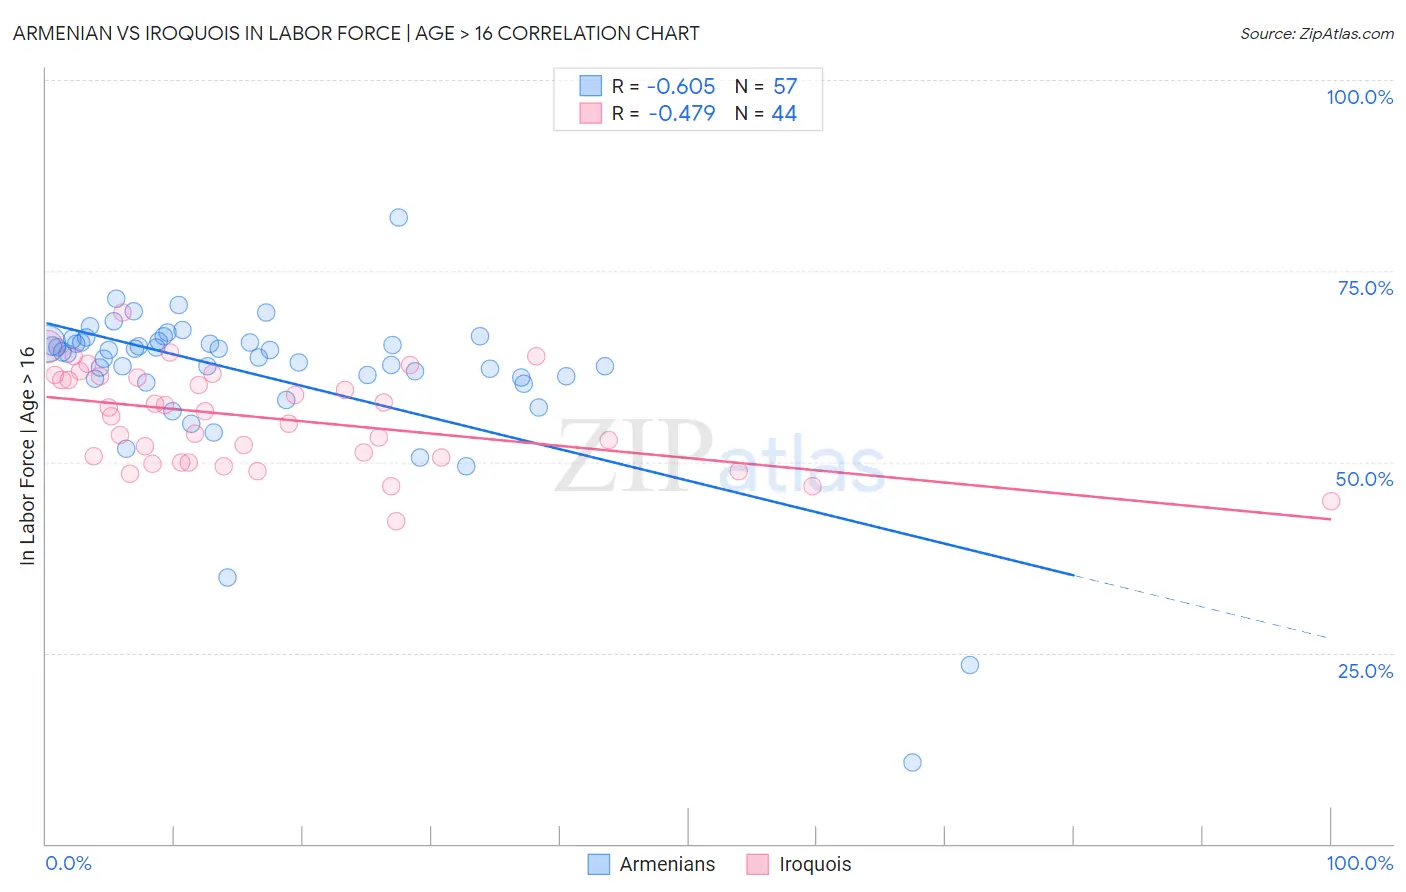
Armenian vs Iroquois In Labor Force | Age > 16 Correlation Chart
The statistical analysis conducted on geographies consisting of 310,962,108 people shows a significant negative correlation between the proportion of Armenians and labor force participation rate among population ages 16 and over in the United States with a correlation coefficient (R) of -0.605 and weighted average of 64.9%. Similarly, the statistical analysis conducted on geographies consisting of 207,293,305 people shows a moderate negative correlation between the proportion of Iroquois and labor force participation rate among population ages 16 and over in the United States with a correlation coefficient (R) of -0.479 and weighted average of 63.2%, a difference of 2.7%.
In Labor Force | Age > 16 Correlation Summary
| Measurement | Armenian | Iroquois |
| Minimum | 10.6% | 42.3% |
| Maximum | 82.0% | 69.6% |
| Range | 71.4% | 27.3% |
| Mean | 61.4% | 55.7% |
| Median | 64.4% | 56.3% |
| Interquartile 25% (IQ1) | 60.9% | 50.3% |
| Interquartile 75% (IQ3) | 65.7% | 61.2% |
| Interquartile Range (IQR) | 4.8% | 10.9% |
| Standard Deviation (Sample) | 10.8% | 6.3% |
| Standard Deviation (Population) | 10.7% | 6.3% |
Similar Demographics by In Labor Force | Age > 16
Demographics Similar to Armenians by In Labor Force | Age > 16
In terms of in labor force | age > 16, the demographic groups most similar to Armenians are Ukrainian (64.9%, a difference of 0.010%), Immigrants from Belgium (64.9%, a difference of 0.020%), Russian (64.9%, a difference of 0.030%), Slovene (64.9%, a difference of 0.030%), and Jamaican (64.9%, a difference of 0.030%).
| Demographics | Rating | Rank | In Labor Force | Age > 16 |
| Immigrants | Europe | 33.6 /100 | #193 | Fair 65.0% |
| Immigrants | Southern Europe | 31.3 /100 | #194 | Fair 65.0% |
| Romanians | 31.1 /100 | #195 | Fair 65.0% |
| Haitians | 30.6 /100 | #196 | Fair 65.0% |
| Immigrants | Italy | 28.7 /100 | #197 | Fair 65.0% |
| Greeks | 26.1 /100 | #198 | Fair 64.9% |
| Mexican American Indians | 23.1 /100 | #199 | Fair 64.9% |
| Armenians | 20.2 /100 | #200 | Fair 64.9% |
| Ukrainians | 19.6 /100 | #201 | Poor 64.9% |
| Immigrants | Belgium | 19.4 /100 | #202 | Poor 64.9% |
| Russians | 18.8 /100 | #203 | Poor 64.9% |
| Slovenes | 18.7 /100 | #204 | Poor 64.9% |
| Jamaicans | 18.7 /100 | #205 | Poor 64.9% |
| Lithuanians | 17.4 /100 | #206 | Poor 64.8% |
| Immigrants | Latin America | 16.4 /100 | #207 | Poor 64.8% |
Demographics Similar to Iroquois by In Labor Force | Age > 16
In terms of in labor force | age > 16, the demographic groups most similar to Iroquois are Blackfeet (63.2%, a difference of 0.060%), Shoshone (63.2%, a difference of 0.070%), Chippewa (63.1%, a difference of 0.13%), Scotch-Irish (63.3%, a difference of 0.14%), and Yaqui (63.0%, a difference of 0.23%).
| Demographics | Rating | Rank | In Labor Force | Age > 16 |
| Osage | 0.0 /100 | #305 | Tragic 63.5% |
| Blacks/African Americans | 0.0 /100 | #306 | Tragic 63.4% |
| Central American Indians | 0.0 /100 | #307 | Tragic 63.4% |
| Pennsylvania Germans | 0.0 /100 | #308 | Tragic 63.4% |
| Scotch-Irish | 0.0 /100 | #309 | Tragic 63.3% |
| Shoshone | 0.0 /100 | #310 | Tragic 63.2% |
| Blackfeet | 0.0 /100 | #311 | Tragic 63.2% |
| Iroquois | 0.0 /100 | #312 | Tragic 63.2% |
| Chippewa | 0.0 /100 | #313 | Tragic 63.1% |
| Yaqui | 0.0 /100 | #314 | Tragic 63.0% |
| Potawatomi | 0.0 /100 | #315 | Tragic 62.8% |
| Yup'ik | 0.0 /100 | #316 | Tragic 62.7% |
| Kiowa | 0.0 /100 | #317 | Tragic 62.4% |
| Chickasaw | 0.0 /100 | #318 | Tragic 62.3% |
| Arapaho | 0.0 /100 | #319 | Tragic 62.1% |