Armenian vs Ugandan In Labor Force | Age > 16
COMPARE
Armenian
Ugandan
In Labor Force | Age > 16
In Labor Force | Age > 16 Comparison
Armenians
Ugandans
64.9%
IN LABOR FORCE | AGE > 16
20.2/ 100
METRIC RATING
200th/ 347
METRIC RANK
67.4%
IN LABOR FORCE | AGE > 16
100.0/ 100
METRIC RATING
24th/ 347
METRIC RANK
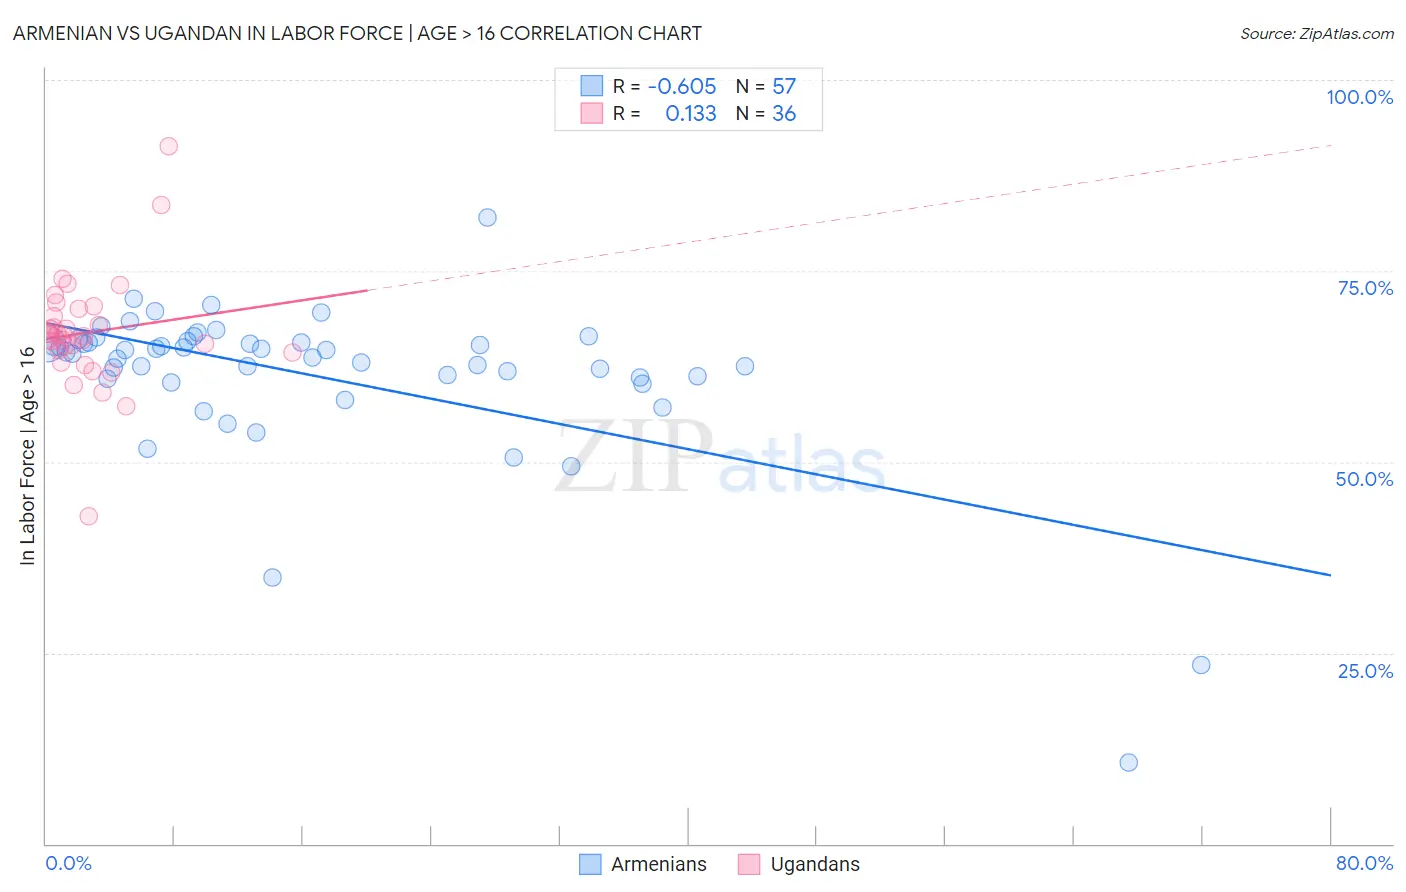
Armenian vs Ugandan In Labor Force | Age > 16 Correlation Chart
The statistical analysis conducted on geographies consisting of 310,962,108 people shows a significant negative correlation between the proportion of Armenians and labor force participation rate among population ages 16 and over in the United States with a correlation coefficient (R) of -0.605 and weighted average of 64.9%. Similarly, the statistical analysis conducted on geographies consisting of 94,018,069 people shows a poor positive correlation between the proportion of Ugandans and labor force participation rate among population ages 16 and over in the United States with a correlation coefficient (R) of 0.133 and weighted average of 67.4%, a difference of 3.9%.
In Labor Force | Age > 16 Correlation Summary
| Measurement | Armenian | Ugandan |
| Minimum | 10.6% | 42.9% |
| Maximum | 82.0% | 91.4% |
| Range | 71.4% | 48.5% |
| Mean | 61.4% | 66.9% |
| Median | 64.4% | 66.5% |
| Interquartile 25% (IQ1) | 60.9% | 64.5% |
| Interquartile 75% (IQ3) | 65.7% | 69.6% |
| Interquartile Range (IQR) | 4.8% | 5.1% |
| Standard Deviation (Sample) | 10.8% | 7.5% |
| Standard Deviation (Population) | 10.7% | 7.4% |
Similar Demographics by In Labor Force | Age > 16
Demographics Similar to Armenians by In Labor Force | Age > 16
In terms of in labor force | age > 16, the demographic groups most similar to Armenians are Ukrainian (64.9%, a difference of 0.010%), Immigrants from Belgium (64.9%, a difference of 0.020%), Russian (64.9%, a difference of 0.030%), Slovene (64.9%, a difference of 0.030%), and Jamaican (64.9%, a difference of 0.030%).
| Demographics | Rating | Rank | In Labor Force | Age > 16 |
| Immigrants | Europe | 33.6 /100 | #193 | Fair 65.0% |
| Immigrants | Southern Europe | 31.3 /100 | #194 | Fair 65.0% |
| Romanians | 31.1 /100 | #195 | Fair 65.0% |
| Haitians | 30.6 /100 | #196 | Fair 65.0% |
| Immigrants | Italy | 28.7 /100 | #197 | Fair 65.0% |
| Greeks | 26.1 /100 | #198 | Fair 64.9% |
| Mexican American Indians | 23.1 /100 | #199 | Fair 64.9% |
| Armenians | 20.2 /100 | #200 | Fair 64.9% |
| Ukrainians | 19.6 /100 | #201 | Poor 64.9% |
| Immigrants | Belgium | 19.4 /100 | #202 | Poor 64.9% |
| Russians | 18.8 /100 | #203 | Poor 64.9% |
| Slovenes | 18.7 /100 | #204 | Poor 64.9% |
| Jamaicans | 18.7 /100 | #205 | Poor 64.9% |
| Lithuanians | 17.4 /100 | #206 | Poor 64.8% |
| Immigrants | Latin America | 16.4 /100 | #207 | Poor 64.8% |
Demographics Similar to Ugandans by In Labor Force | Age > 16
In terms of in labor force | age > 16, the demographic groups most similar to Ugandans are Immigrants from Africa (67.4%, a difference of 0.030%), Immigrants from Cabo Verde (67.3%, a difference of 0.050%), Cambodian (67.4%, a difference of 0.060%), Zimbabwean (67.3%, a difference of 0.13%), and Immigrants from Uganda (67.5%, a difference of 0.18%).
| Demographics | Rating | Rank | In Labor Force | Age > 16 |
| Immigrants | India | 100.0 /100 | #17 | Exceptional 67.6% |
| Immigrants | Liberia | 100.0 /100 | #18 | Exceptional 67.6% |
| Kenyans | 100.0 /100 | #19 | Exceptional 67.6% |
| Immigrants | Kenya | 100.0 /100 | #20 | Exceptional 67.6% |
| Tongans | 100.0 /100 | #21 | Exceptional 67.5% |
| Immigrants | Uganda | 100.0 /100 | #22 | Exceptional 67.5% |
| Cambodians | 100.0 /100 | #23 | Exceptional 67.4% |
| Ugandans | 100.0 /100 | #24 | Exceptional 67.4% |
| Immigrants | Africa | 100.0 /100 | #25 | Exceptional 67.4% |
| Immigrants | Cabo Verde | 100.0 /100 | #26 | Exceptional 67.3% |
| Zimbabweans | 100.0 /100 | #27 | Exceptional 67.3% |
| Immigrants | Morocco | 100.0 /100 | #28 | Exceptional 67.2% |
| Thais | 100.0 /100 | #29 | Exceptional 67.2% |
| Immigrants | Zaire | 100.0 /100 | #30 | Exceptional 67.2% |
| Ghanaians | 100.0 /100 | #31 | Exceptional 67.1% |