Armenian vs Bermudan In Labor Force | Age > 16
COMPARE
Armenian
Bermudan
In Labor Force | Age > 16
In Labor Force | Age > 16 Comparison
Armenians
Bermudans
64.9%
IN LABOR FORCE | AGE > 16
20.2/ 100
METRIC RATING
200th/ 347
METRIC RANK
66.0%
IN LABOR FORCE | AGE > 16
99.3/ 100
METRIC RATING
88th/ 347
METRIC RANK
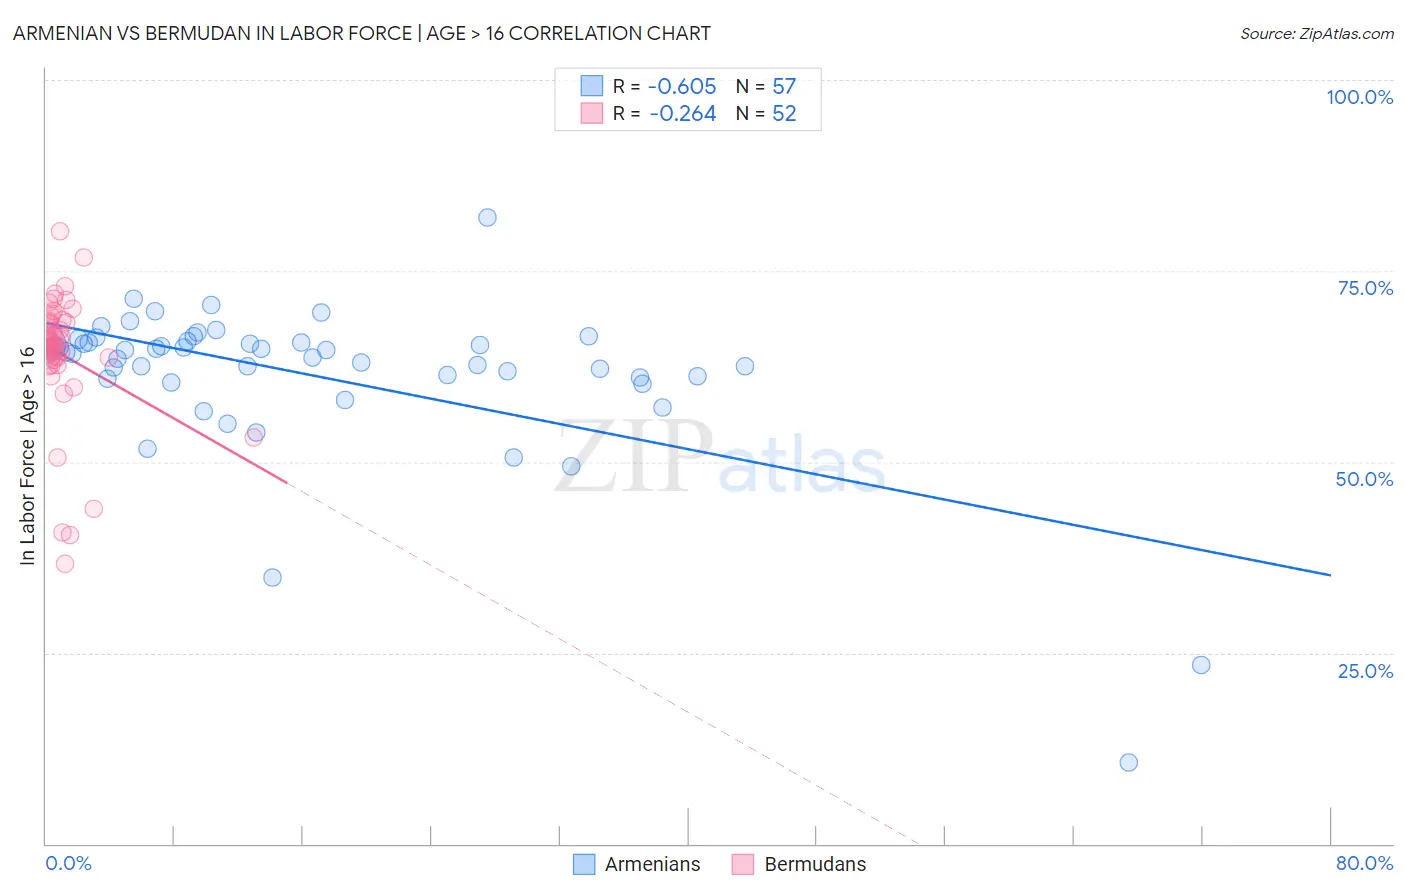
Armenian vs Bermudan In Labor Force | Age > 16 Correlation Chart
The statistical analysis conducted on geographies consisting of 310,962,108 people shows a significant negative correlation between the proportion of Armenians and labor force participation rate among population ages 16 and over in the United States with a correlation coefficient (R) of -0.605 and weighted average of 64.9%. Similarly, the statistical analysis conducted on geographies consisting of 55,730,379 people shows a weak negative correlation between the proportion of Bermudans and labor force participation rate among population ages 16 and over in the United States with a correlation coefficient (R) of -0.264 and weighted average of 66.0%, a difference of 1.8%.
In Labor Force | Age > 16 Correlation Summary
| Measurement | Armenian | Bermudan |
| Minimum | 10.6% | 36.6% |
| Maximum | 82.0% | 80.2% |
| Range | 71.4% | 43.6% |
| Mean | 61.4% | 64.1% |
| Median | 64.4% | 65.6% |
| Interquartile 25% (IQ1) | 60.9% | 63.4% |
| Interquartile 75% (IQ3) | 65.7% | 68.3% |
| Interquartile Range (IQR) | 4.8% | 4.9% |
| Standard Deviation (Sample) | 10.8% | 8.4% |
| Standard Deviation (Population) | 10.7% | 8.3% |
Similar Demographics by In Labor Force | Age > 16
Demographics Similar to Armenians by In Labor Force | Age > 16
In terms of in labor force | age > 16, the demographic groups most similar to Armenians are Ukrainian (64.9%, a difference of 0.010%), Immigrants from Belgium (64.9%, a difference of 0.020%), Russian (64.9%, a difference of 0.030%), Slovene (64.9%, a difference of 0.030%), and Jamaican (64.9%, a difference of 0.030%).
| Demographics | Rating | Rank | In Labor Force | Age > 16 |
| Immigrants | Europe | 33.6 /100 | #193 | Fair 65.0% |
| Immigrants | Southern Europe | 31.3 /100 | #194 | Fair 65.0% |
| Romanians | 31.1 /100 | #195 | Fair 65.0% |
| Haitians | 30.6 /100 | #196 | Fair 65.0% |
| Immigrants | Italy | 28.7 /100 | #197 | Fair 65.0% |
| Greeks | 26.1 /100 | #198 | Fair 64.9% |
| Mexican American Indians | 23.1 /100 | #199 | Fair 64.9% |
| Armenians | 20.2 /100 | #200 | Fair 64.9% |
| Ukrainians | 19.6 /100 | #201 | Poor 64.9% |
| Immigrants | Belgium | 19.4 /100 | #202 | Poor 64.9% |
| Russians | 18.8 /100 | #203 | Poor 64.9% |
| Slovenes | 18.7 /100 | #204 | Poor 64.9% |
| Jamaicans | 18.7 /100 | #205 | Poor 64.9% |
| Lithuanians | 17.4 /100 | #206 | Poor 64.8% |
| Immigrants | Latin America | 16.4 /100 | #207 | Poor 64.8% |
Demographics Similar to Bermudans by In Labor Force | Age > 16
In terms of in labor force | age > 16, the demographic groups most similar to Bermudans are South American Indian (66.0%, a difference of 0.0%), South American (66.0%, a difference of 0.010%), Mongolian (66.1%, a difference of 0.030%), Immigrants from Jordan (66.1%, a difference of 0.040%), and Central American (66.1%, a difference of 0.040%).
| Demographics | Rating | Rank | In Labor Force | Age > 16 |
| Moroccans | 99.5 /100 | #81 | Exceptional 66.1% |
| German Russians | 99.4 /100 | #82 | Exceptional 66.1% |
| Immigrants | Jordan | 99.4 /100 | #83 | Exceptional 66.1% |
| Central Americans | 99.4 /100 | #84 | Exceptional 66.1% |
| Mongolians | 99.4 /100 | #85 | Exceptional 66.1% |
| South Americans | 99.4 /100 | #86 | Exceptional 66.0% |
| South American Indians | 99.4 /100 | #87 | Exceptional 66.0% |
| Bermudans | 99.3 /100 | #88 | Exceptional 66.0% |
| Immigrants | Laos | 99.2 /100 | #89 | Exceptional 66.0% |
| Chileans | 99.2 /100 | #90 | Exceptional 66.0% |
| Iranians | 99.2 /100 | #91 | Exceptional 66.0% |
| Aleuts | 99.1 /100 | #92 | Exceptional 66.0% |
| Immigrants | South America | 99.1 /100 | #93 | Exceptional 66.0% |
| Immigrants | Cambodia | 99.1 /100 | #94 | Exceptional 66.0% |
| Immigrants | Uruguay | 99.1 /100 | #95 | Exceptional 66.0% |