Armenian vs Arab In Labor Force | Age > 16
COMPARE
Armenian
Arab
In Labor Force | Age > 16
In Labor Force | Age > 16 Comparison
Armenians
Arabs
64.9%
IN LABOR FORCE | AGE > 16
20.2/ 100
METRIC RATING
200th/ 347
METRIC RANK
65.2%
IN LABOR FORCE | AGE > 16
62.4/ 100
METRIC RATING
169th/ 347
METRIC RANK
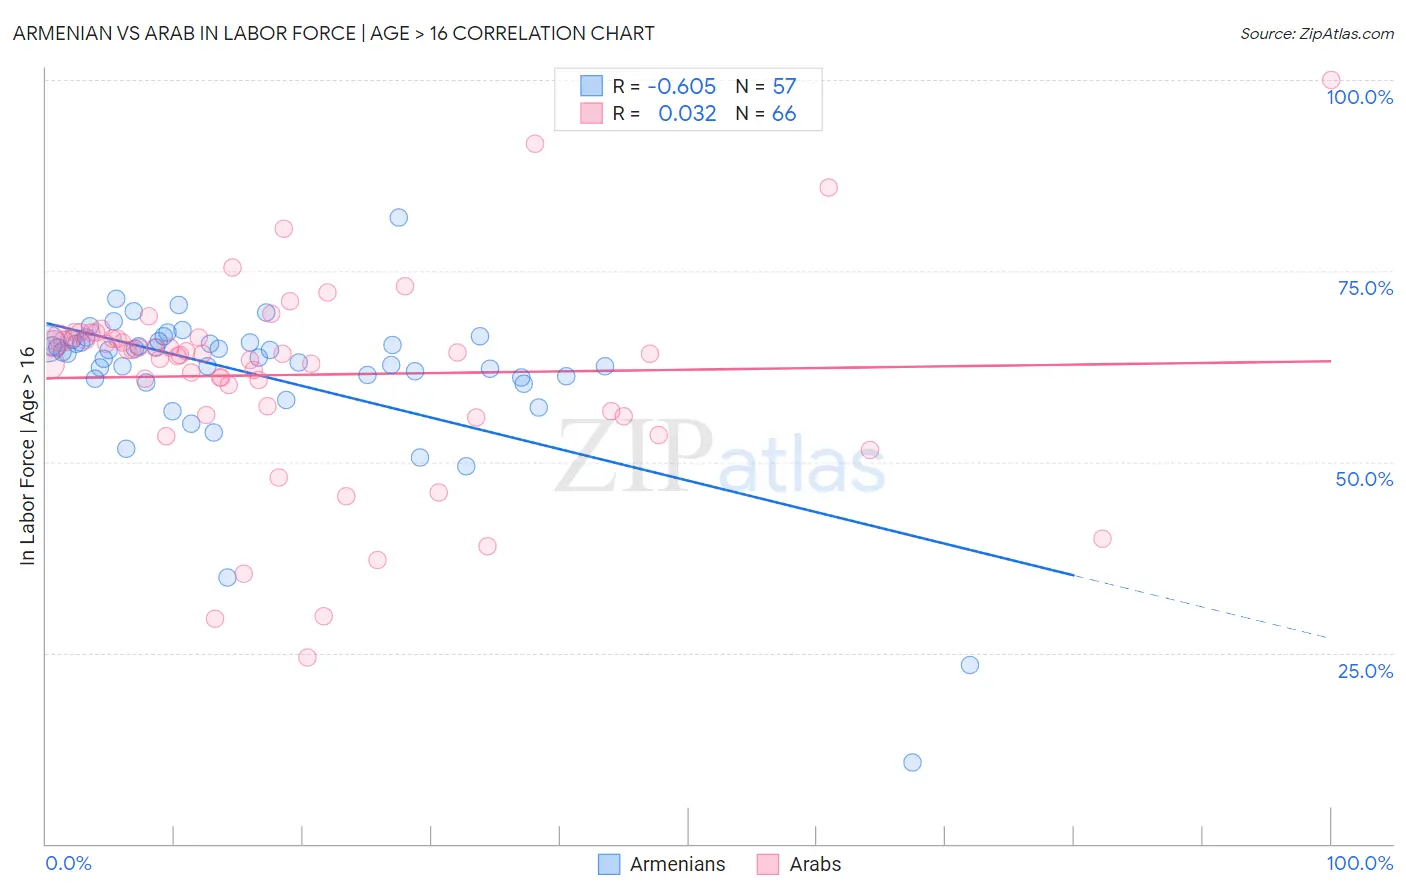
Armenian vs Arab In Labor Force | Age > 16 Correlation Chart
The statistical analysis conducted on geographies consisting of 310,962,108 people shows a significant negative correlation between the proportion of Armenians and labor force participation rate among population ages 16 and over in the United States with a correlation coefficient (R) of -0.605 and weighted average of 64.9%. Similarly, the statistical analysis conducted on geographies consisting of 486,878,981 people shows no correlation between the proportion of Arabs and labor force participation rate among population ages 16 and over in the United States with a correlation coefficient (R) of 0.032 and weighted average of 65.2%, a difference of 0.53%.
In Labor Force | Age > 16 Correlation Summary
| Measurement | Armenian | Arab |
| Minimum | 10.6% | 24.4% |
| Maximum | 82.0% | 100.0% |
| Range | 71.4% | 75.6% |
| Mean | 61.4% | 61.4% |
| Median | 64.4% | 64.2% |
| Interquartile 25% (IQ1) | 60.9% | 56.7% |
| Interquartile 75% (IQ3) | 65.7% | 66.2% |
| Interquartile Range (IQR) | 4.8% | 9.5% |
| Standard Deviation (Sample) | 10.8% | 13.1% |
| Standard Deviation (Population) | 10.7% | 13.0% |
Similar Demographics by In Labor Force | Age > 16
Demographics Similar to Armenians by In Labor Force | Age > 16
In terms of in labor force | age > 16, the demographic groups most similar to Armenians are Ukrainian (64.9%, a difference of 0.010%), Immigrants from Belgium (64.9%, a difference of 0.020%), Russian (64.9%, a difference of 0.030%), Slovene (64.9%, a difference of 0.030%), and Jamaican (64.9%, a difference of 0.030%).
| Demographics | Rating | Rank | In Labor Force | Age > 16 |
| Immigrants | Europe | 33.6 /100 | #193 | Fair 65.0% |
| Immigrants | Southern Europe | 31.3 /100 | #194 | Fair 65.0% |
| Romanians | 31.1 /100 | #195 | Fair 65.0% |
| Haitians | 30.6 /100 | #196 | Fair 65.0% |
| Immigrants | Italy | 28.7 /100 | #197 | Fair 65.0% |
| Greeks | 26.1 /100 | #198 | Fair 64.9% |
| Mexican American Indians | 23.1 /100 | #199 | Fair 64.9% |
| Armenians | 20.2 /100 | #200 | Fair 64.9% |
| Ukrainians | 19.6 /100 | #201 | Poor 64.9% |
| Immigrants | Belgium | 19.4 /100 | #202 | Poor 64.9% |
| Russians | 18.8 /100 | #203 | Poor 64.9% |
| Slovenes | 18.7 /100 | #204 | Poor 64.9% |
| Jamaicans | 18.7 /100 | #205 | Poor 64.9% |
| Lithuanians | 17.4 /100 | #206 | Poor 64.8% |
| Immigrants | Latin America | 16.4 /100 | #207 | Poor 64.8% |
Demographics Similar to Arabs by In Labor Force | Age > 16
In terms of in labor force | age > 16, the demographic groups most similar to Arabs are Serbian (65.2%, a difference of 0.010%), Immigrants from Israel (65.2%, a difference of 0.010%), Israeli (65.2%, a difference of 0.010%), Immigrants from Sweden (65.2%, a difference of 0.010%), and Immigrants from Belarus (65.2%, a difference of 0.040%).
| Demographics | Rating | Rank | In Labor Force | Age > 16 |
| Albanians | 70.8 /100 | #162 | Good 65.3% |
| South Africans | 69.8 /100 | #163 | Good 65.3% |
| Danes | 68.8 /100 | #164 | Good 65.3% |
| Immigrants | Kazakhstan | 68.1 /100 | #165 | Good 65.3% |
| Immigrants | Western Asia | 67.3 /100 | #166 | Good 65.3% |
| Immigrants | Belarus | 66.0 /100 | #167 | Good 65.2% |
| Serbians | 63.5 /100 | #168 | Good 65.2% |
| Arabs | 62.4 /100 | #169 | Good 65.2% |
| Immigrants | Israel | 61.7 /100 | #170 | Good 65.2% |
| Israelis | 61.6 /100 | #171 | Good 65.2% |
| Immigrants | Sweden | 61.3 /100 | #172 | Good 65.2% |
| Immigrants | Ukraine | 53.7 /100 | #173 | Average 65.1% |
| Macedonians | 50.0 /100 | #174 | Average 65.1% |
| Nicaraguans | 49.7 /100 | #175 | Average 65.1% |
| Swedes | 47.4 /100 | #176 | Average 65.1% |