Immigrants from Sierra Leone vs Iroquois In Labor Force | Age > 16
COMPARE
Immigrants from Sierra Leone
Iroquois
In Labor Force | Age > 16
In Labor Force | Age > 16 Comparison
Immigrants from Sierra Leone
Iroquois
68.5%
IN LABOR FORCE | AGE > 16
100.0/ 100
METRIC RATING
8th/ 347
METRIC RANK
63.2%
IN LABOR FORCE | AGE > 16
0.0/ 100
METRIC RATING
312th/ 347
METRIC RANK
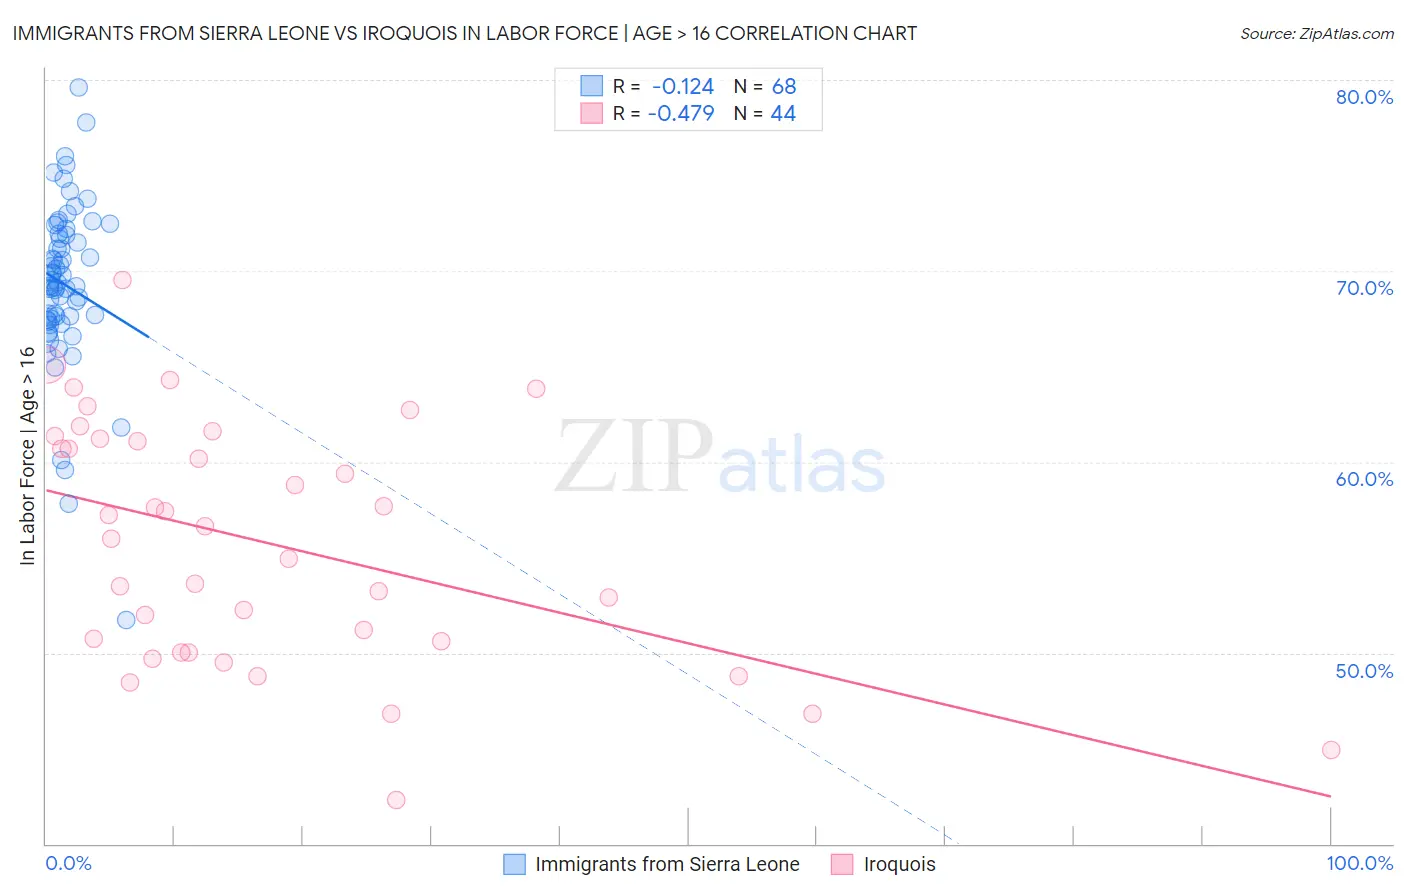
Immigrants from Sierra Leone vs Iroquois In Labor Force | Age > 16 Correlation Chart
The statistical analysis conducted on geographies consisting of 101,649,709 people shows a poor negative correlation between the proportion of Immigrants from Sierra Leone and labor force participation rate among population ages 16 and over in the United States with a correlation coefficient (R) of -0.124 and weighted average of 68.5%. Similarly, the statistical analysis conducted on geographies consisting of 207,293,305 people shows a moderate negative correlation between the proportion of Iroquois and labor force participation rate among population ages 16 and over in the United States with a correlation coefficient (R) of -0.479 and weighted average of 63.2%, a difference of 8.4%.
In Labor Force | Age > 16 Correlation Summary
| Measurement | Immigrants from Sierra Leone | Iroquois |
| Minimum | 51.7% | 42.3% |
| Maximum | 79.6% | 69.6% |
| Range | 27.9% | 27.3% |
| Mean | 69.3% | 55.7% |
| Median | 69.3% | 56.3% |
| Interquartile 25% (IQ1) | 67.5% | 50.3% |
| Interquartile 75% (IQ3) | 71.9% | 61.2% |
| Interquartile Range (IQR) | 4.5% | 10.9% |
| Standard Deviation (Sample) | 4.4% | 6.3% |
| Standard Deviation (Population) | 4.4% | 6.3% |
Similar Demographics by In Labor Force | Age > 16
Demographics Similar to Immigrants from Sierra Leone by In Labor Force | Age > 16
In terms of in labor force | age > 16, the demographic groups most similar to Immigrants from Sierra Leone are Immigrants from Eastern Africa (68.5%, a difference of 0.010%), Immigrants from Bolivia (68.4%, a difference of 0.050%), Immigrants from Cameroon (68.7%, a difference of 0.32%), Bolivian (68.2%, a difference of 0.41%), and Immigrants from Eritrea (68.9%, a difference of 0.57%).
| Demographics | Rating | Rank | In Labor Force | Age > 16 |
| Immigrants | Ethiopia | 100.0 /100 | #1 | Exceptional 69.4% |
| Ethiopians | 100.0 /100 | #2 | Exceptional 69.3% |
| Somalis | 100.0 /100 | #3 | Exceptional 69.2% |
| Immigrants | Somalia | 100.0 /100 | #4 | Exceptional 69.1% |
| Sierra Leoneans | 100.0 /100 | #5 | Exceptional 68.9% |
| Immigrants | Eritrea | 100.0 /100 | #6 | Exceptional 68.9% |
| Immigrants | Cameroon | 100.0 /100 | #7 | Exceptional 68.7% |
| Immigrants | Sierra Leone | 100.0 /100 | #8 | Exceptional 68.5% |
| Immigrants | Eastern Africa | 100.0 /100 | #9 | Exceptional 68.5% |
| Immigrants | Bolivia | 100.0 /100 | #10 | Exceptional 68.4% |
| Bolivians | 100.0 /100 | #11 | Exceptional 68.2% |
| Sudanese | 100.0 /100 | #12 | Exceptional 68.0% |
| Immigrants | Nepal | 100.0 /100 | #13 | Exceptional 68.0% |
| Liberians | 100.0 /100 | #14 | Exceptional 67.8% |
| Immigrants | Middle Africa | 100.0 /100 | #15 | Exceptional 67.7% |
Demographics Similar to Iroquois by In Labor Force | Age > 16
In terms of in labor force | age > 16, the demographic groups most similar to Iroquois are Blackfeet (63.2%, a difference of 0.060%), Shoshone (63.2%, a difference of 0.070%), Chippewa (63.1%, a difference of 0.13%), Scotch-Irish (63.3%, a difference of 0.14%), and Yaqui (63.0%, a difference of 0.23%).
| Demographics | Rating | Rank | In Labor Force | Age > 16 |
| Osage | 0.0 /100 | #305 | Tragic 63.5% |
| Blacks/African Americans | 0.0 /100 | #306 | Tragic 63.4% |
| Central American Indians | 0.0 /100 | #307 | Tragic 63.4% |
| Pennsylvania Germans | 0.0 /100 | #308 | Tragic 63.4% |
| Scotch-Irish | 0.0 /100 | #309 | Tragic 63.3% |
| Shoshone | 0.0 /100 | #310 | Tragic 63.2% |
| Blackfeet | 0.0 /100 | #311 | Tragic 63.2% |
| Iroquois | 0.0 /100 | #312 | Tragic 63.2% |
| Chippewa | 0.0 /100 | #313 | Tragic 63.1% |
| Yaqui | 0.0 /100 | #314 | Tragic 63.0% |
| Potawatomi | 0.0 /100 | #315 | Tragic 62.8% |
| Yup'ik | 0.0 /100 | #316 | Tragic 62.7% |
| Kiowa | 0.0 /100 | #317 | Tragic 62.4% |
| Chickasaw | 0.0 /100 | #318 | Tragic 62.3% |
| Arapaho | 0.0 /100 | #319 | Tragic 62.1% |