Immigrants from Armenia vs Iroquois In Labor Force | Age > 16
COMPARE
Immigrants from Armenia
Iroquois
In Labor Force | Age > 16
In Labor Force | Age > 16 Comparison
Immigrants from Armenia
Iroquois
65.3%
IN LABOR FORCE | AGE > 16
76.6/ 100
METRIC RATING
155th/ 347
METRIC RANK
63.2%
IN LABOR FORCE | AGE > 16
0.0/ 100
METRIC RATING
312th/ 347
METRIC RANK
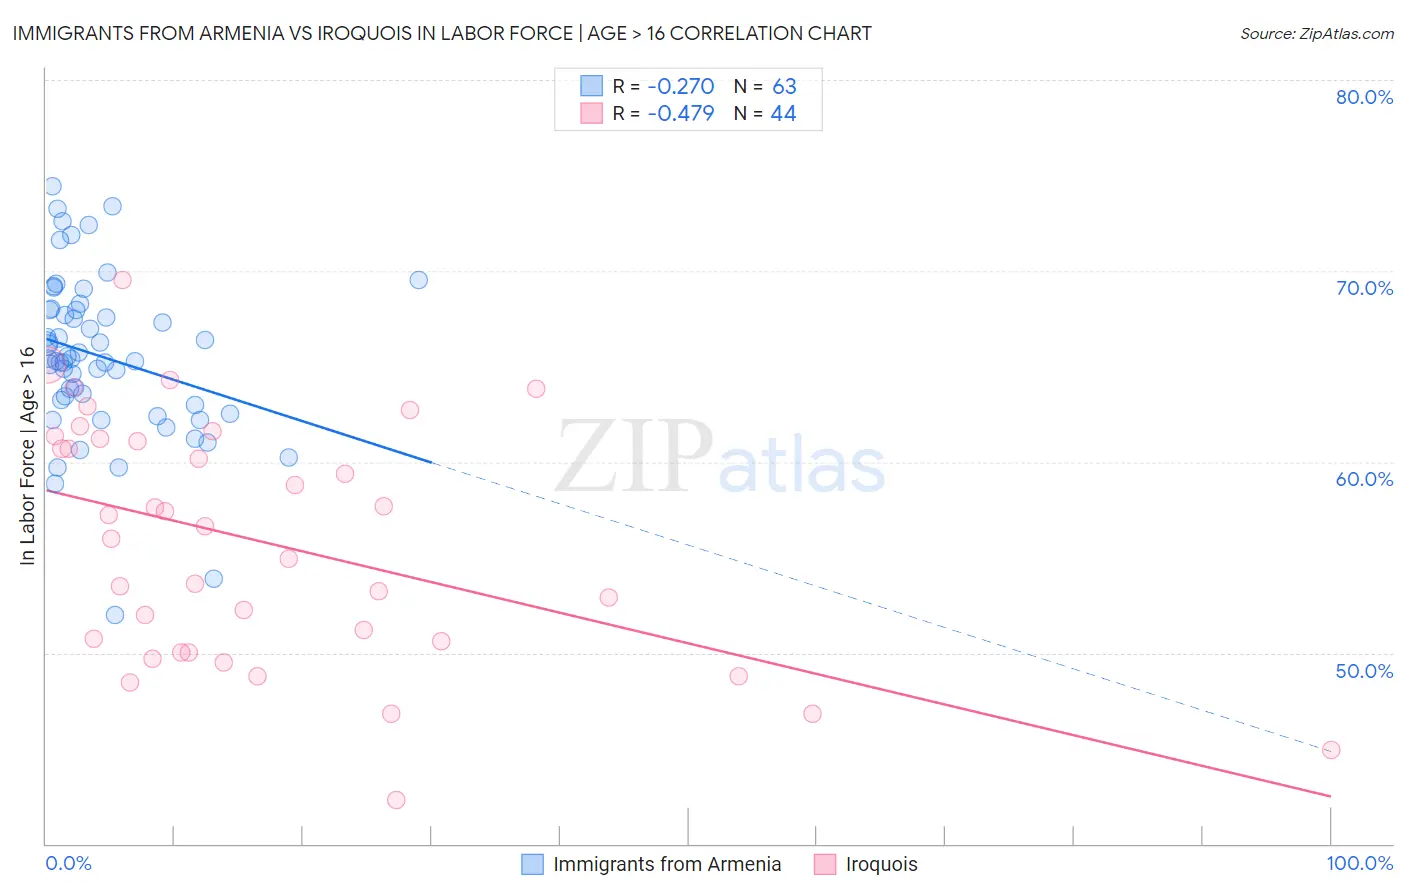
Immigrants from Armenia vs Iroquois In Labor Force | Age > 16 Correlation Chart
The statistical analysis conducted on geographies consisting of 97,718,343 people shows a weak negative correlation between the proportion of Immigrants from Armenia and labor force participation rate among population ages 16 and over in the United States with a correlation coefficient (R) of -0.270 and weighted average of 65.3%. Similarly, the statistical analysis conducted on geographies consisting of 207,293,305 people shows a moderate negative correlation between the proportion of Iroquois and labor force participation rate among population ages 16 and over in the United States with a correlation coefficient (R) of -0.479 and weighted average of 63.2%, a difference of 3.4%.
In Labor Force | Age > 16 Correlation Summary
| Measurement | Immigrants from Armenia | Iroquois |
| Minimum | 52.0% | 42.3% |
| Maximum | 74.4% | 69.6% |
| Range | 22.4% | 27.3% |
| Mean | 65.5% | 55.7% |
| Median | 65.4% | 56.3% |
| Interquartile 25% (IQ1) | 63.0% | 50.3% |
| Interquartile 75% (IQ3) | 68.0% | 61.2% |
| Interquartile Range (IQR) | 5.0% | 10.9% |
| Standard Deviation (Sample) | 4.3% | 6.3% |
| Standard Deviation (Population) | 4.2% | 6.3% |
Similar Demographics by In Labor Force | Age > 16
Demographics Similar to Immigrants from Armenia by In Labor Force | Age > 16
In terms of in labor force | age > 16, the demographic groups most similar to Immigrants from Armenia are Immigrants from Ireland (65.3%, a difference of 0.010%), Immigrants from Russia (65.3%, a difference of 0.010%), Panamanian (65.3%, a difference of 0.020%), Immigrants from Eastern Europe (65.4%, a difference of 0.030%), and Immigrants from Syria (65.3%, a difference of 0.030%).
| Demographics | Rating | Rank | In Labor Force | Age > 16 |
| Bhutanese | 86.3 /100 | #148 | Excellent 65.5% |
| Immigrants | Albania | 85.7 /100 | #149 | Excellent 65.4% |
| Immigrants | Immigrants | 81.9 /100 | #150 | Excellent 65.4% |
| Czechs | 81.5 /100 | #151 | Excellent 65.4% |
| Yugoslavians | 81.3 /100 | #152 | Excellent 65.4% |
| Immigrants | China | 80.5 /100 | #153 | Excellent 65.4% |
| Immigrants | Eastern Europe | 78.3 /100 | #154 | Good 65.4% |
| Immigrants | Armenia | 76.6 /100 | #155 | Good 65.3% |
| Immigrants | Ireland | 75.9 /100 | #156 | Good 65.3% |
| Immigrants | Russia | 75.7 /100 | #157 | Good 65.3% |
| Panamanians | 75.2 /100 | #158 | Good 65.3% |
| Immigrants | Syria | 74.6 /100 | #159 | Good 65.3% |
| Immigrants | South Africa | 73.5 /100 | #160 | Good 65.3% |
| Australians | 71.3 /100 | #161 | Good 65.3% |
| Albanians | 70.8 /100 | #162 | Good 65.3% |
Demographics Similar to Iroquois by In Labor Force | Age > 16
In terms of in labor force | age > 16, the demographic groups most similar to Iroquois are Blackfeet (63.2%, a difference of 0.060%), Shoshone (63.2%, a difference of 0.070%), Chippewa (63.1%, a difference of 0.13%), Scotch-Irish (63.3%, a difference of 0.14%), and Yaqui (63.0%, a difference of 0.23%).
| Demographics | Rating | Rank | In Labor Force | Age > 16 |
| Osage | 0.0 /100 | #305 | Tragic 63.5% |
| Blacks/African Americans | 0.0 /100 | #306 | Tragic 63.4% |
| Central American Indians | 0.0 /100 | #307 | Tragic 63.4% |
| Pennsylvania Germans | 0.0 /100 | #308 | Tragic 63.4% |
| Scotch-Irish | 0.0 /100 | #309 | Tragic 63.3% |
| Shoshone | 0.0 /100 | #310 | Tragic 63.2% |
| Blackfeet | 0.0 /100 | #311 | Tragic 63.2% |
| Iroquois | 0.0 /100 | #312 | Tragic 63.2% |
| Chippewa | 0.0 /100 | #313 | Tragic 63.1% |
| Yaqui | 0.0 /100 | #314 | Tragic 63.0% |
| Potawatomi | 0.0 /100 | #315 | Tragic 62.8% |
| Yup'ik | 0.0 /100 | #316 | Tragic 62.7% |
| Kiowa | 0.0 /100 | #317 | Tragic 62.4% |
| Chickasaw | 0.0 /100 | #318 | Tragic 62.3% |
| Arapaho | 0.0 /100 | #319 | Tragic 62.1% |