Apache vs Iroquois In Labor Force | Age > 16
COMPARE
Apache
Iroquois
In Labor Force | Age > 16
In Labor Force | Age > 16 Comparison
Apache
Iroquois
60.7%
IN LABOR FORCE | AGE > 16
0.0/ 100
METRIC RATING
334th/ 347
METRIC RANK
63.2%
IN LABOR FORCE | AGE > 16
0.0/ 100
METRIC RATING
312th/ 347
METRIC RANK
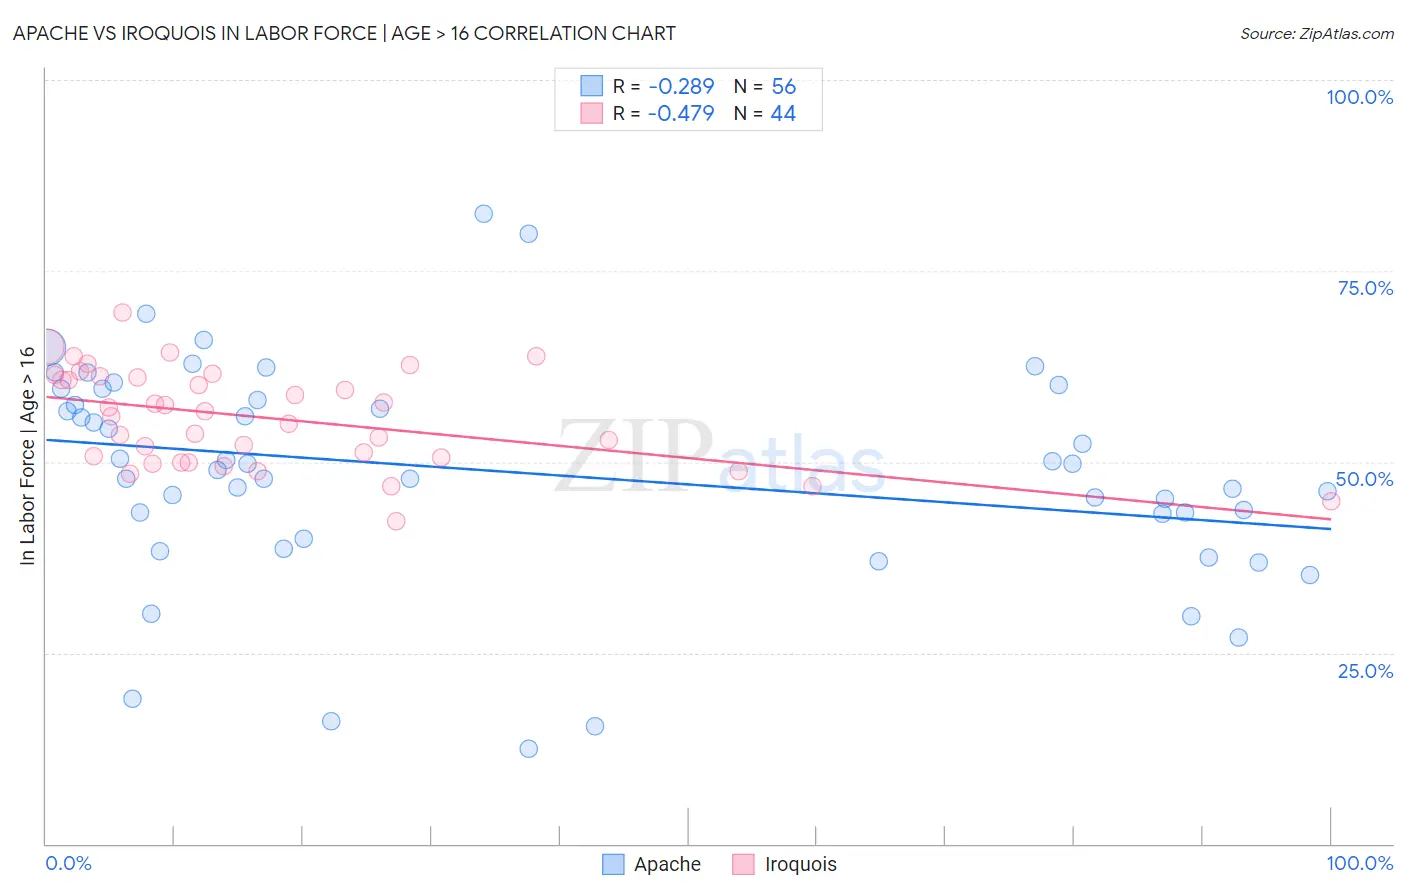
Apache vs Iroquois In Labor Force | Age > 16 Correlation Chart
The statistical analysis conducted on geographies consisting of 231,124,853 people shows a weak negative correlation between the proportion of Apache and labor force participation rate among population ages 16 and over in the United States with a correlation coefficient (R) of -0.289 and weighted average of 60.7%. Similarly, the statistical analysis conducted on geographies consisting of 207,293,305 people shows a moderate negative correlation between the proportion of Iroquois and labor force participation rate among population ages 16 and over in the United States with a correlation coefficient (R) of -0.479 and weighted average of 63.2%, a difference of 4.1%.
In Labor Force | Age > 16 Correlation Summary
| Measurement | Apache | Iroquois |
| Minimum | 12.5% | 42.3% |
| Maximum | 82.5% | 69.6% |
| Range | 70.0% | 27.3% |
| Mean | 48.6% | 55.7% |
| Median | 49.3% | 56.3% |
| Interquartile 25% (IQ1) | 41.6% | 50.3% |
| Interquartile 75% (IQ3) | 58.8% | 61.2% |
| Interquartile Range (IQR) | 17.2% | 10.9% |
| Standard Deviation (Sample) | 14.5% | 6.3% |
| Standard Deviation (Population) | 14.4% | 6.3% |
Similar Demographics by In Labor Force | Age > 16
Demographics Similar to Apache by In Labor Force | Age > 16
In terms of in labor force | age > 16, the demographic groups most similar to Apache are Paiute (60.7%, a difference of 0.050%), Crow (60.8%, a difference of 0.13%), Native/Alaskan (60.6%, a difference of 0.19%), Menominee (60.6%, a difference of 0.21%), and Ute (60.9%, a difference of 0.30%).
| Demographics | Rating | Rank | In Labor Force | Age > 16 |
| Cajuns | 0.0 /100 | #327 | Tragic 61.8% |
| Dutch West Indians | 0.0 /100 | #328 | Tragic 61.7% |
| Choctaw | 0.0 /100 | #329 | Tragic 61.5% |
| Creek | 0.0 /100 | #330 | Tragic 61.3% |
| Ute | 0.0 /100 | #331 | Tragic 60.9% |
| Crow | 0.0 /100 | #332 | Tragic 60.8% |
| Paiute | 0.0 /100 | #333 | Tragic 60.7% |
| Apache | 0.0 /100 | #334 | Tragic 60.7% |
| Natives/Alaskans | 0.0 /100 | #335 | Tragic 60.6% |
| Menominee | 0.0 /100 | #336 | Tragic 60.6% |
| Colville | 0.0 /100 | #337 | Tragic 59.8% |
| Immigrants | Yemen | 0.0 /100 | #338 | Tragic 59.6% |
| Houma | 0.0 /100 | #339 | Tragic 59.5% |
| Pueblo | 0.0 /100 | #340 | Tragic 59.3% |
| Hopi | 0.0 /100 | #341 | Tragic 58.4% |
Demographics Similar to Iroquois by In Labor Force | Age > 16
In terms of in labor force | age > 16, the demographic groups most similar to Iroquois are Blackfeet (63.2%, a difference of 0.060%), Shoshone (63.2%, a difference of 0.070%), Chippewa (63.1%, a difference of 0.13%), Scotch-Irish (63.3%, a difference of 0.14%), and Yaqui (63.0%, a difference of 0.23%).
| Demographics | Rating | Rank | In Labor Force | Age > 16 |
| Osage | 0.0 /100 | #305 | Tragic 63.5% |
| Blacks/African Americans | 0.0 /100 | #306 | Tragic 63.4% |
| Central American Indians | 0.0 /100 | #307 | Tragic 63.4% |
| Pennsylvania Germans | 0.0 /100 | #308 | Tragic 63.4% |
| Scotch-Irish | 0.0 /100 | #309 | Tragic 63.3% |
| Shoshone | 0.0 /100 | #310 | Tragic 63.2% |
| Blackfeet | 0.0 /100 | #311 | Tragic 63.2% |
| Iroquois | 0.0 /100 | #312 | Tragic 63.2% |
| Chippewa | 0.0 /100 | #313 | Tragic 63.1% |
| Yaqui | 0.0 /100 | #314 | Tragic 63.0% |
| Potawatomi | 0.0 /100 | #315 | Tragic 62.8% |
| Yup'ik | 0.0 /100 | #316 | Tragic 62.7% |
| Kiowa | 0.0 /100 | #317 | Tragic 62.4% |
| Chickasaw | 0.0 /100 | #318 | Tragic 62.3% |
| Arapaho | 0.0 /100 | #319 | Tragic 62.1% |