Arab vs British West Indian In Labor Force | Age 20-64
COMPARE
Arab
British West Indian
In Labor Force | Age 20-64
In Labor Force | Age 20-64 Comparison
Arabs
British West Indians
79.2%
IN LABOR FORCE | AGE 20-64
11.4/ 100
METRIC RATING
216th/ 347
METRIC RANK
78.4%
IN LABOR FORCE | AGE 20-64
0.1/ 100
METRIC RATING
265th/ 347
METRIC RANK
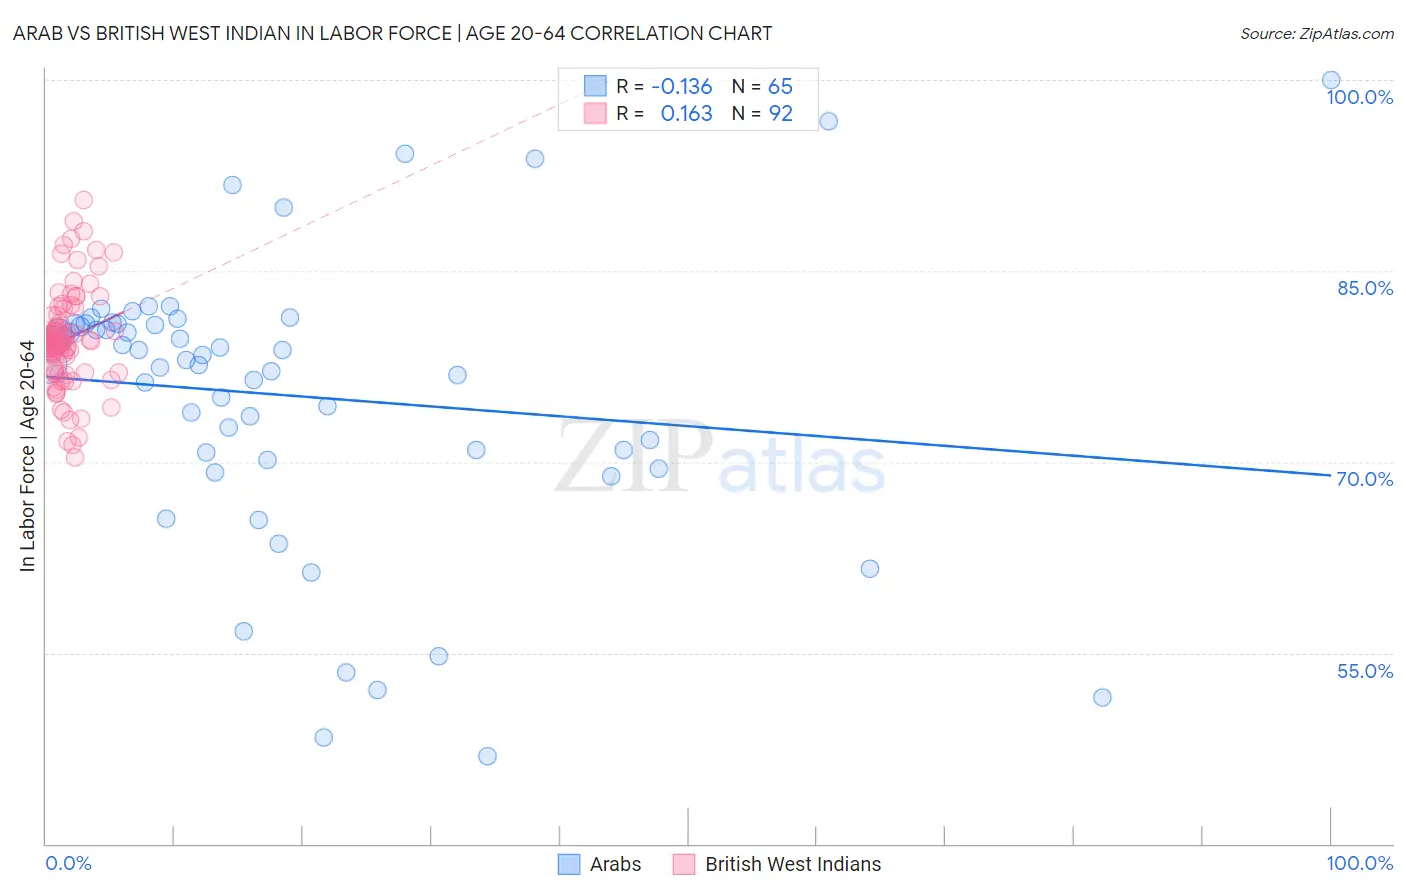
Arab vs British West Indian In Labor Force | Age 20-64 Correlation Chart
The statistical analysis conducted on geographies consisting of 486,876,166 people shows a poor negative correlation between the proportion of Arabs and labor force participation rate among population between the ages 20 and 64 in the United States with a correlation coefficient (R) of -0.136 and weighted average of 79.2%. Similarly, the statistical analysis conducted on geographies consisting of 152,617,449 people shows a poor positive correlation between the proportion of British West Indians and labor force participation rate among population between the ages 20 and 64 in the United States with a correlation coefficient (R) of 0.163 and weighted average of 78.4%, a difference of 1.1%.
In Labor Force | Age 20-64 Correlation Summary
| Measurement | Arab | British West Indian |
| Minimum | 46.9% | 70.3% |
| Maximum | 100.0% | 90.6% |
| Range | 53.1% | 20.3% |
| Mean | 75.2% | 79.6% |
| Median | 78.0% | 79.4% |
| Interquartile 25% (IQ1) | 70.4% | 77.2% |
| Interquartile 75% (IQ3) | 80.8% | 81.5% |
| Interquartile Range (IQR) | 10.4% | 4.3% |
| Standard Deviation (Sample) | 11.1% | 3.9% |
| Standard Deviation (Population) | 11.0% | 3.9% |
Similar Demographics by In Labor Force | Age 20-64
Demographics Similar to Arabs by In Labor Force | Age 20-64
In terms of in labor force | age 20-64, the demographic groups most similar to Arabs are Immigrants from Armenia (79.2%, a difference of 0.010%), Immigrants from Norway (79.2%, a difference of 0.010%), Immigrants from Western Asia (79.2%, a difference of 0.010%), Irish (79.3%, a difference of 0.030%), and Immigrants from Portugal (79.3%, a difference of 0.030%).
| Demographics | Rating | Rank | In Labor Force | Age 20-64 |
| Bangladeshis | 16.4 /100 | #209 | Poor 79.3% |
| Haitians | 16.1 /100 | #210 | Poor 79.3% |
| Europeans | 15.3 /100 | #211 | Poor 79.3% |
| Irish | 13.2 /100 | #212 | Poor 79.3% |
| Immigrants | Portugal | 12.8 /100 | #213 | Poor 79.3% |
| Immigrants | Armenia | 12.2 /100 | #214 | Poor 79.2% |
| Immigrants | Norway | 12.0 /100 | #215 | Poor 79.2% |
| Arabs | 11.4 /100 | #216 | Poor 79.2% |
| Immigrants | Western Asia | 11.0 /100 | #217 | Poor 79.2% |
| Immigrants | England | 9.3 /100 | #218 | Tragic 79.2% |
| French Canadians | 8.4 /100 | #219 | Tragic 79.2% |
| Immigrants | Immigrants | 7.7 /100 | #220 | Tragic 79.2% |
| Hungarians | 7.2 /100 | #221 | Tragic 79.2% |
| Immigrants | Panama | 6.9 /100 | #222 | Tragic 79.1% |
| Canadians | 6.8 /100 | #223 | Tragic 79.1% |
Demographics Similar to British West Indians by In Labor Force | Age 20-64
In terms of in labor force | age 20-64, the demographic groups most similar to British West Indians are Bahamian (78.4%, a difference of 0.010%), U.S. Virgin Islander (78.4%, a difference of 0.030%), Spaniard (78.4%, a difference of 0.040%), Pennsylvania German (78.4%, a difference of 0.050%), and West Indian (78.3%, a difference of 0.050%).
| Demographics | Rating | Rank | In Labor Force | Age 20-64 |
| Immigrants | Guatemala | 0.4 /100 | #258 | Tragic 78.7% |
| Tsimshian | 0.4 /100 | #259 | Tragic 78.7% |
| Immigrants | Fiji | 0.3 /100 | #260 | Tragic 78.6% |
| Whites/Caucasians | 0.2 /100 | #261 | Tragic 78.5% |
| Fijians | 0.1 /100 | #262 | Tragic 78.4% |
| Pennsylvania Germans | 0.1 /100 | #263 | Tragic 78.4% |
| Spaniards | 0.1 /100 | #264 | Tragic 78.4% |
| British West Indians | 0.1 /100 | #265 | Tragic 78.4% |
| Bahamians | 0.1 /100 | #266 | Tragic 78.4% |
| U.S. Virgin Islanders | 0.1 /100 | #267 | Tragic 78.4% |
| West Indians | 0.0 /100 | #268 | Tragic 78.3% |
| Immigrants | Barbados | 0.0 /100 | #269 | Tragic 78.3% |
| Scotch-Irish | 0.0 /100 | #270 | Tragic 78.3% |
| Immigrants | Latin America | 0.0 /100 | #271 | Tragic 78.3% |
| Marshallese | 0.0 /100 | #272 | Tragic 78.3% |