Arab vs Immigrants from Zaire In Labor Force | Age 20-64
COMPARE
Arab
Immigrants from Zaire
In Labor Force | Age 20-64
In Labor Force | Age 20-64 Comparison
Arabs
Immigrants from Zaire
79.2%
IN LABOR FORCE | AGE 20-64
11.4/ 100
METRIC RATING
216th/ 347
METRIC RANK
79.9%
IN LABOR FORCE | AGE 20-64
88.6/ 100
METRIC RATING
130th/ 347
METRIC RANK
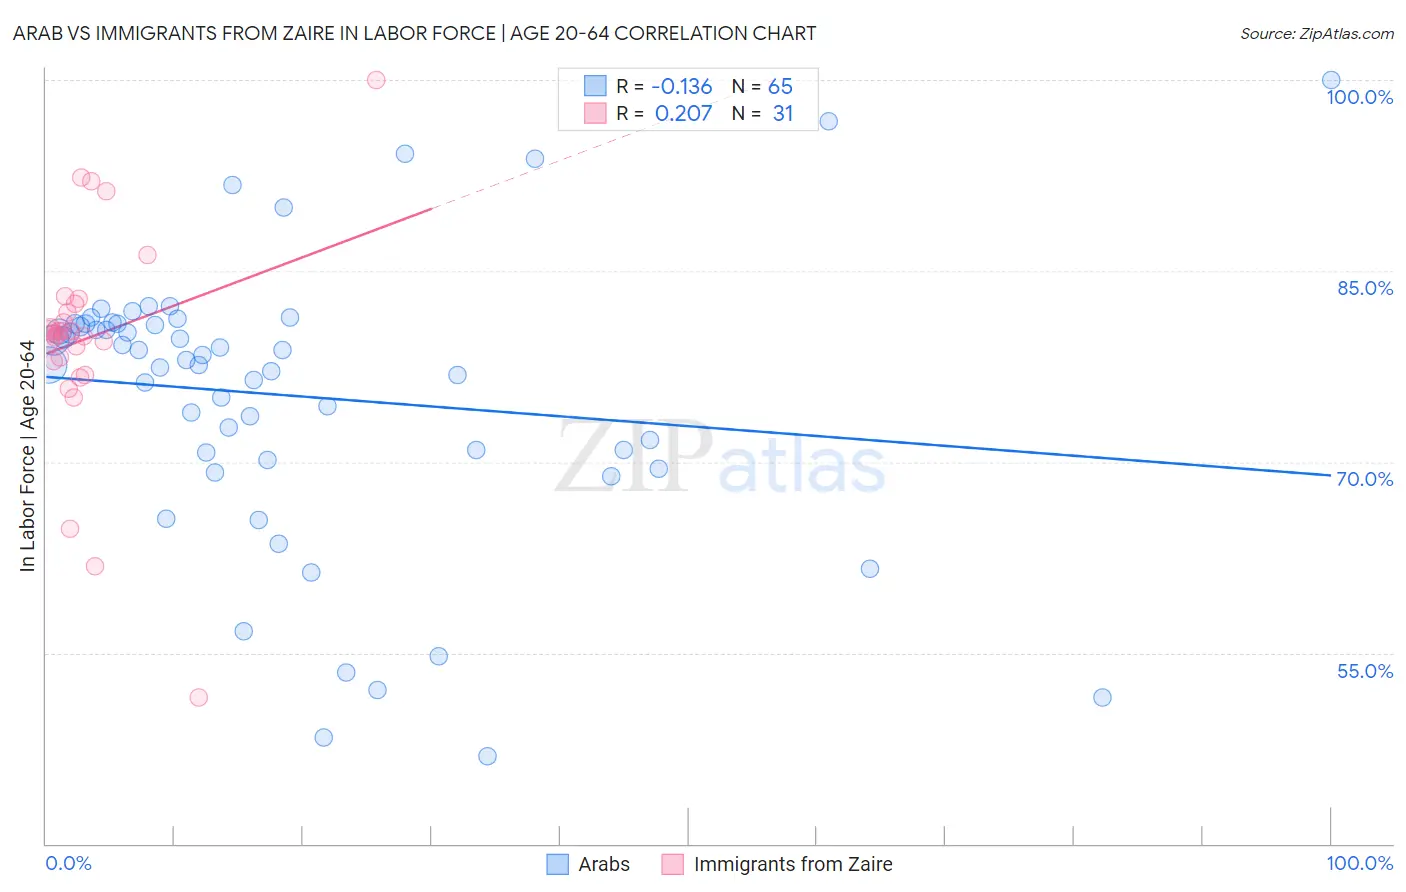
Arab vs Immigrants from Zaire In Labor Force | Age 20-64 Correlation Chart
The statistical analysis conducted on geographies consisting of 486,876,166 people shows a poor negative correlation between the proportion of Arabs and labor force participation rate among population between the ages 20 and 64 in the United States with a correlation coefficient (R) of -0.136 and weighted average of 79.2%. Similarly, the statistical analysis conducted on geographies consisting of 107,255,436 people shows a weak positive correlation between the proportion of Immigrants from Zaire and labor force participation rate among population between the ages 20 and 64 in the United States with a correlation coefficient (R) of 0.207 and weighted average of 79.9%, a difference of 0.83%.
In Labor Force | Age 20-64 Correlation Summary
| Measurement | Arab | Immigrants from Zaire |
| Minimum | 46.9% | 51.5% |
| Maximum | 100.0% | 100.0% |
| Range | 53.1% | 48.5% |
| Mean | 75.2% | 79.7% |
| Median | 78.0% | 80.0% |
| Interquartile 25% (IQ1) | 70.4% | 77.9% |
| Interquartile 75% (IQ3) | 80.8% | 82.4% |
| Interquartile Range (IQR) | 10.4% | 4.5% |
| Standard Deviation (Sample) | 11.1% | 8.8% |
| Standard Deviation (Population) | 11.0% | 8.7% |
Similar Demographics by In Labor Force | Age 20-64
Demographics Similar to Arabs by In Labor Force | Age 20-64
In terms of in labor force | age 20-64, the demographic groups most similar to Arabs are Immigrants from Armenia (79.2%, a difference of 0.010%), Immigrants from Norway (79.2%, a difference of 0.010%), Immigrants from Western Asia (79.2%, a difference of 0.010%), Irish (79.3%, a difference of 0.030%), and Immigrants from Portugal (79.3%, a difference of 0.030%).
| Demographics | Rating | Rank | In Labor Force | Age 20-64 |
| Bangladeshis | 16.4 /100 | #209 | Poor 79.3% |
| Haitians | 16.1 /100 | #210 | Poor 79.3% |
| Europeans | 15.3 /100 | #211 | Poor 79.3% |
| Irish | 13.2 /100 | #212 | Poor 79.3% |
| Immigrants | Portugal | 12.8 /100 | #213 | Poor 79.3% |
| Immigrants | Armenia | 12.2 /100 | #214 | Poor 79.2% |
| Immigrants | Norway | 12.0 /100 | #215 | Poor 79.2% |
| Arabs | 11.4 /100 | #216 | Poor 79.2% |
| Immigrants | Western Asia | 11.0 /100 | #217 | Poor 79.2% |
| Immigrants | England | 9.3 /100 | #218 | Tragic 79.2% |
| French Canadians | 8.4 /100 | #219 | Tragic 79.2% |
| Immigrants | Immigrants | 7.7 /100 | #220 | Tragic 79.2% |
| Hungarians | 7.2 /100 | #221 | Tragic 79.2% |
| Immigrants | Panama | 6.9 /100 | #222 | Tragic 79.1% |
| Canadians | 6.8 /100 | #223 | Tragic 79.1% |
Demographics Similar to Immigrants from Zaire by In Labor Force | Age 20-64
In terms of in labor force | age 20-64, the demographic groups most similar to Immigrants from Zaire are Italian (79.9%, a difference of 0.010%), Immigrants from Iran (79.9%, a difference of 0.010%), Immigrants from Czechoslovakia (79.9%, a difference of 0.020%), Immigrants from Eastern Asia (79.9%, a difference of 0.020%), and Indian (Asian) (79.9%, a difference of 0.020%).
| Demographics | Rating | Rank | In Labor Force | Age 20-64 |
| Immigrants | Russia | 91.8 /100 | #123 | Exceptional 79.9% |
| Immigrants | Europe | 91.6 /100 | #124 | Exceptional 79.9% |
| Danes | 91.5 /100 | #125 | Exceptional 79.9% |
| Immigrants | France | 90.7 /100 | #126 | Exceptional 79.9% |
| Immigrants | Czechoslovakia | 89.7 /100 | #127 | Excellent 79.9% |
| Immigrants | Eastern Asia | 89.4 /100 | #128 | Excellent 79.9% |
| Italians | 88.9 /100 | #129 | Excellent 79.9% |
| Immigrants | Zaire | 88.6 /100 | #130 | Excellent 79.9% |
| Immigrants | Iran | 88.3 /100 | #131 | Excellent 79.9% |
| Indians (Asian) | 87.7 /100 | #132 | Excellent 79.9% |
| South American Indians | 87.6 /100 | #133 | Excellent 79.9% |
| Belgians | 87.4 /100 | #134 | Excellent 79.9% |
| Ukrainians | 86.8 /100 | #135 | Excellent 79.9% |
| Immigrants | Singapore | 86.7 /100 | #136 | Excellent 79.9% |
| Immigrants | Ukraine | 86.5 /100 | #137 | Excellent 79.9% |