Arab vs Armenian In Labor Force | Age 20-64
COMPARE
Arab
Armenian
In Labor Force | Age 20-64
In Labor Force | Age 20-64 Comparison
Arabs
Armenians
79.2%
IN LABOR FORCE | AGE 20-64
11.4/ 100
METRIC RATING
216th/ 347
METRIC RANK
79.5%
IN LABOR FORCE | AGE 20-64
41.4/ 100
METRIC RATING
179th/ 347
METRIC RANK
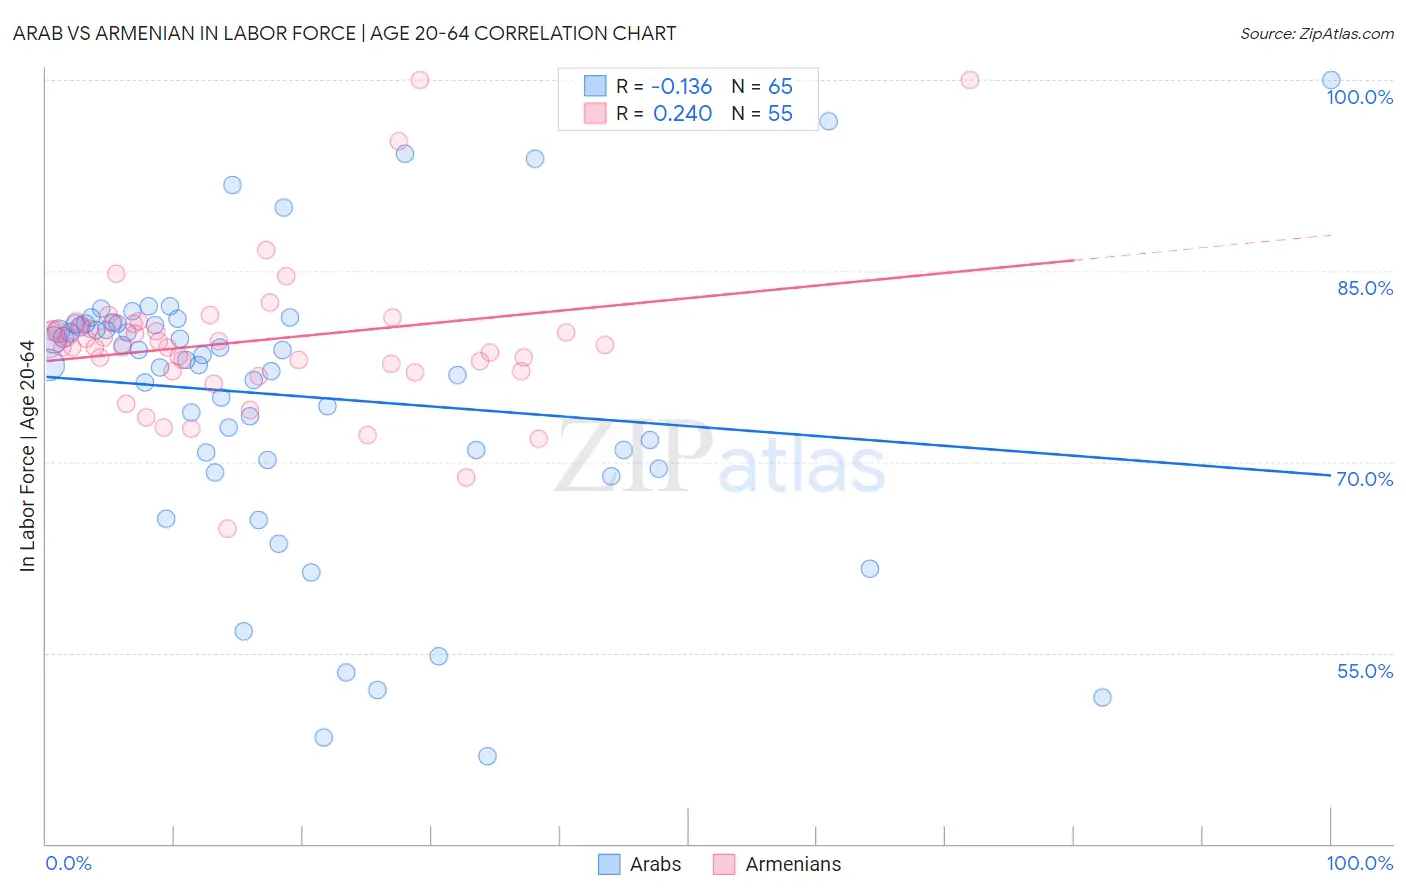
Arab vs Armenian In Labor Force | Age 20-64 Correlation Chart
The statistical analysis conducted on geographies consisting of 486,876,166 people shows a poor negative correlation between the proportion of Arabs and labor force participation rate among population between the ages 20 and 64 in the United States with a correlation coefficient (R) of -0.136 and weighted average of 79.2%. Similarly, the statistical analysis conducted on geographies consisting of 310,959,496 people shows a weak positive correlation between the proportion of Armenians and labor force participation rate among population between the ages 20 and 64 in the United States with a correlation coefficient (R) of 0.240 and weighted average of 79.5%, a difference of 0.34%.
In Labor Force | Age 20-64 Correlation Summary
| Measurement | Arab | Armenian |
| Minimum | 46.9% | 64.7% |
| Maximum | 100.0% | 100.0% |
| Range | 53.1% | 35.3% |
| Mean | 75.2% | 79.5% |
| Median | 78.0% | 79.2% |
| Interquartile 25% (IQ1) | 70.4% | 77.1% |
| Interquartile 75% (IQ3) | 80.8% | 80.9% |
| Interquartile Range (IQR) | 10.4% | 3.7% |
| Standard Deviation (Sample) | 11.1% | 5.9% |
| Standard Deviation (Population) | 11.0% | 5.9% |
Similar Demographics by In Labor Force | Age 20-64
Demographics Similar to Arabs by In Labor Force | Age 20-64
In terms of in labor force | age 20-64, the demographic groups most similar to Arabs are Immigrants from Armenia (79.2%, a difference of 0.010%), Immigrants from Norway (79.2%, a difference of 0.010%), Immigrants from Western Asia (79.2%, a difference of 0.010%), Irish (79.3%, a difference of 0.030%), and Immigrants from Portugal (79.3%, a difference of 0.030%).
| Demographics | Rating | Rank | In Labor Force | Age 20-64 |
| Bangladeshis | 16.4 /100 | #209 | Poor 79.3% |
| Haitians | 16.1 /100 | #210 | Poor 79.3% |
| Europeans | 15.3 /100 | #211 | Poor 79.3% |
| Irish | 13.2 /100 | #212 | Poor 79.3% |
| Immigrants | Portugal | 12.8 /100 | #213 | Poor 79.3% |
| Immigrants | Armenia | 12.2 /100 | #214 | Poor 79.2% |
| Immigrants | Norway | 12.0 /100 | #215 | Poor 79.2% |
| Arabs | 11.4 /100 | #216 | Poor 79.2% |
| Immigrants | Western Asia | 11.0 /100 | #217 | Poor 79.2% |
| Immigrants | England | 9.3 /100 | #218 | Tragic 79.2% |
| French Canadians | 8.4 /100 | #219 | Tragic 79.2% |
| Immigrants | Immigrants | 7.7 /100 | #220 | Tragic 79.2% |
| Hungarians | 7.2 /100 | #221 | Tragic 79.2% |
| Immigrants | Panama | 6.9 /100 | #222 | Tragic 79.1% |
| Canadians | 6.8 /100 | #223 | Tragic 79.1% |
Demographics Similar to Armenians by In Labor Force | Age 20-64
In terms of in labor force | age 20-64, the demographic groups most similar to Armenians are Salvadoran (79.5%, a difference of 0.0%), Czechoslovakian (79.5%, a difference of 0.020%), Immigrants from Netherlands (79.5%, a difference of 0.030%), Immigrants from Saudi Arabia (79.5%, a difference of 0.030%), and Cuban (79.5%, a difference of 0.040%).
| Demographics | Rating | Rank | In Labor Force | Age 20-64 |
| Immigrants | Belgium | 53.1 /100 | #172 | Average 79.6% |
| Immigrants | Scotland | 52.4 /100 | #173 | Average 79.6% |
| Syrians | 50.0 /100 | #174 | Average 79.6% |
| Cubans | 46.1 /100 | #175 | Average 79.5% |
| Australians | 46.0 /100 | #176 | Average 79.5% |
| Immigrants | Netherlands | 45.2 /100 | #177 | Average 79.5% |
| Czechoslovakians | 44.3 /100 | #178 | Average 79.5% |
| Armenians | 41.4 /100 | #179 | Average 79.5% |
| Salvadorans | 41.0 /100 | #180 | Average 79.5% |
| Immigrants | Saudi Arabia | 37.7 /100 | #181 | Fair 79.5% |
| Malaysians | 37.1 /100 | #182 | Fair 79.5% |
| Immigrants | Hungary | 36.8 /100 | #183 | Fair 79.5% |
| Finns | 35.9 /100 | #184 | Fair 79.5% |
| Israelis | 34.7 /100 | #185 | Fair 79.5% |
| Northern Europeans | 34.5 /100 | #186 | Fair 79.5% |