Swedish vs Cheyenne In Labor Force | Age 20-64
COMPARE
Swedish
Cheyenne
In Labor Force | Age 20-64
In Labor Force | Age 20-64 Comparison
Swedes
Cheyenne
80.3%
IN LABOR FORCE | AGE 20-64
98.9/ 100
METRIC RATING
59th/ 347
METRIC RANK
74.8%
IN LABOR FORCE | AGE 20-64
0.0/ 100
METRIC RATING
329th/ 347
METRIC RANK
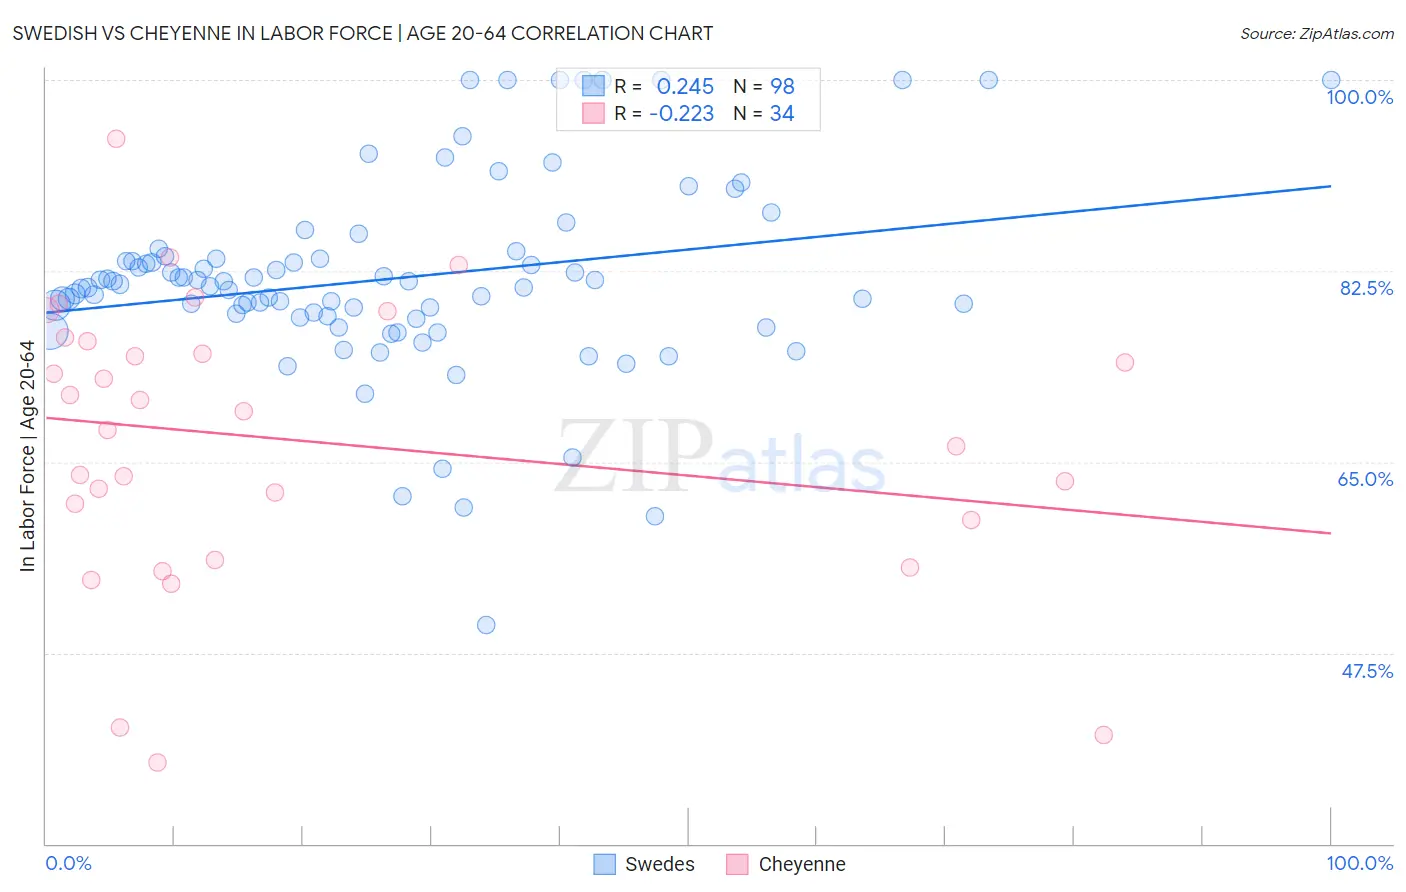
Swedish vs Cheyenne In Labor Force | Age 20-64 Correlation Chart
The statistical analysis conducted on geographies consisting of 539,244,386 people shows a weak positive correlation between the proportion of Swedes and labor force participation rate among population between the ages 20 and 64 in the United States with a correlation coefficient (R) of 0.245 and weighted average of 80.3%. Similarly, the statistical analysis conducted on geographies consisting of 80,710,794 people shows a weak negative correlation between the proportion of Cheyenne and labor force participation rate among population between the ages 20 and 64 in the United States with a correlation coefficient (R) of -0.223 and weighted average of 74.8%, a difference of 7.3%.
In Labor Force | Age 20-64 Correlation Summary
| Measurement | Swedish | Cheyenne |
| Minimum | 50.0% | 37.5% |
| Maximum | 100.0% | 94.6% |
| Range | 50.0% | 57.1% |
| Mean | 81.8% | 66.9% |
| Median | 81.2% | 68.8% |
| Interquartile 25% (IQ1) | 78.4% | 59.7% |
| Interquartile 75% (IQ3) | 83.6% | 76.1% |
| Interquartile Range (IQR) | 5.2% | 16.4% |
| Standard Deviation (Sample) | 8.9% | 13.0% |
| Standard Deviation (Population) | 8.9% | 12.8% |
Similar Demographics by In Labor Force | Age 20-64
Demographics Similar to Swedes by In Labor Force | Age 20-64
In terms of in labor force | age 20-64, the demographic groups most similar to Swedes are Serbian (80.3%, a difference of 0.0%), Tongan (80.3%, a difference of 0.0%), Afghan (80.3%, a difference of 0.010%), Burmese (80.3%, a difference of 0.010%), and Carpatho Rusyn (80.3%, a difference of 0.010%).
| Demographics | Rating | Rank | In Labor Force | Age 20-64 |
| Turks | 99.2 /100 | #52 | Exceptional 80.3% |
| Immigrants | Peru | 99.2 /100 | #53 | Exceptional 80.3% |
| Peruvians | 99.1 /100 | #54 | Exceptional 80.3% |
| Immigrants | Cabo Verde | 99.0 /100 | #55 | Exceptional 80.3% |
| Immigrants | Northern Africa | 99.0 /100 | #56 | Exceptional 80.3% |
| Afghans | 98.9 /100 | #57 | Exceptional 80.3% |
| Serbians | 98.9 /100 | #58 | Exceptional 80.3% |
| Swedes | 98.9 /100 | #59 | Exceptional 80.3% |
| Tongans | 98.8 /100 | #60 | Exceptional 80.3% |
| Burmese | 98.8 /100 | #61 | Exceptional 80.3% |
| Carpatho Rusyns | 98.8 /100 | #62 | Exceptional 80.3% |
| Immigrants | Korea | 98.8 /100 | #63 | Exceptional 80.3% |
| Immigrants | Albania | 98.7 /100 | #64 | Exceptional 80.3% |
| Lithuanians | 98.7 /100 | #65 | Exceptional 80.2% |
| Macedonians | 98.7 /100 | #66 | Exceptional 80.2% |
Demographics Similar to Cheyenne by In Labor Force | Age 20-64
In terms of in labor force | age 20-64, the demographic groups most similar to Cheyenne are Colville (74.8%, a difference of 0.070%), Kiowa (75.0%, a difference of 0.20%), Paiute (74.7%, a difference of 0.20%), Sioux (75.0%, a difference of 0.23%), and Creek (75.1%, a difference of 0.40%).
| Demographics | Rating | Rank | In Labor Force | Age 20-64 |
| Dutch West Indians | 0.0 /100 | #322 | Tragic 75.5% |
| Cajuns | 0.0 /100 | #323 | Tragic 75.5% |
| Choctaw | 0.0 /100 | #324 | Tragic 75.4% |
| Menominee | 0.0 /100 | #325 | Tragic 75.3% |
| Creek | 0.0 /100 | #326 | Tragic 75.1% |
| Sioux | 0.0 /100 | #327 | Tragic 75.0% |
| Kiowa | 0.0 /100 | #328 | Tragic 75.0% |
| Cheyenne | 0.0 /100 | #329 | Tragic 74.8% |
| Colville | 0.0 /100 | #330 | Tragic 74.8% |
| Paiute | 0.0 /100 | #331 | Tragic 74.7% |
| Arapaho | 0.0 /100 | #332 | Tragic 74.4% |
| Natives/Alaskans | 0.0 /100 | #333 | Tragic 73.9% |
| Apache | 0.0 /100 | #334 | Tragic 73.7% |
| Ute | 0.0 /100 | #335 | Tragic 73.7% |
| Crow | 0.0 /100 | #336 | Tragic 73.3% |