British West Indian vs Cheyenne In Labor Force | Age 20-64
COMPARE
British West Indian
Cheyenne
In Labor Force | Age 20-64
In Labor Force | Age 20-64 Comparison
British West Indians
Cheyenne
78.4%
IN LABOR FORCE | AGE 20-64
0.1/ 100
METRIC RATING
265th/ 347
METRIC RANK
74.8%
IN LABOR FORCE | AGE 20-64
0.0/ 100
METRIC RATING
329th/ 347
METRIC RANK
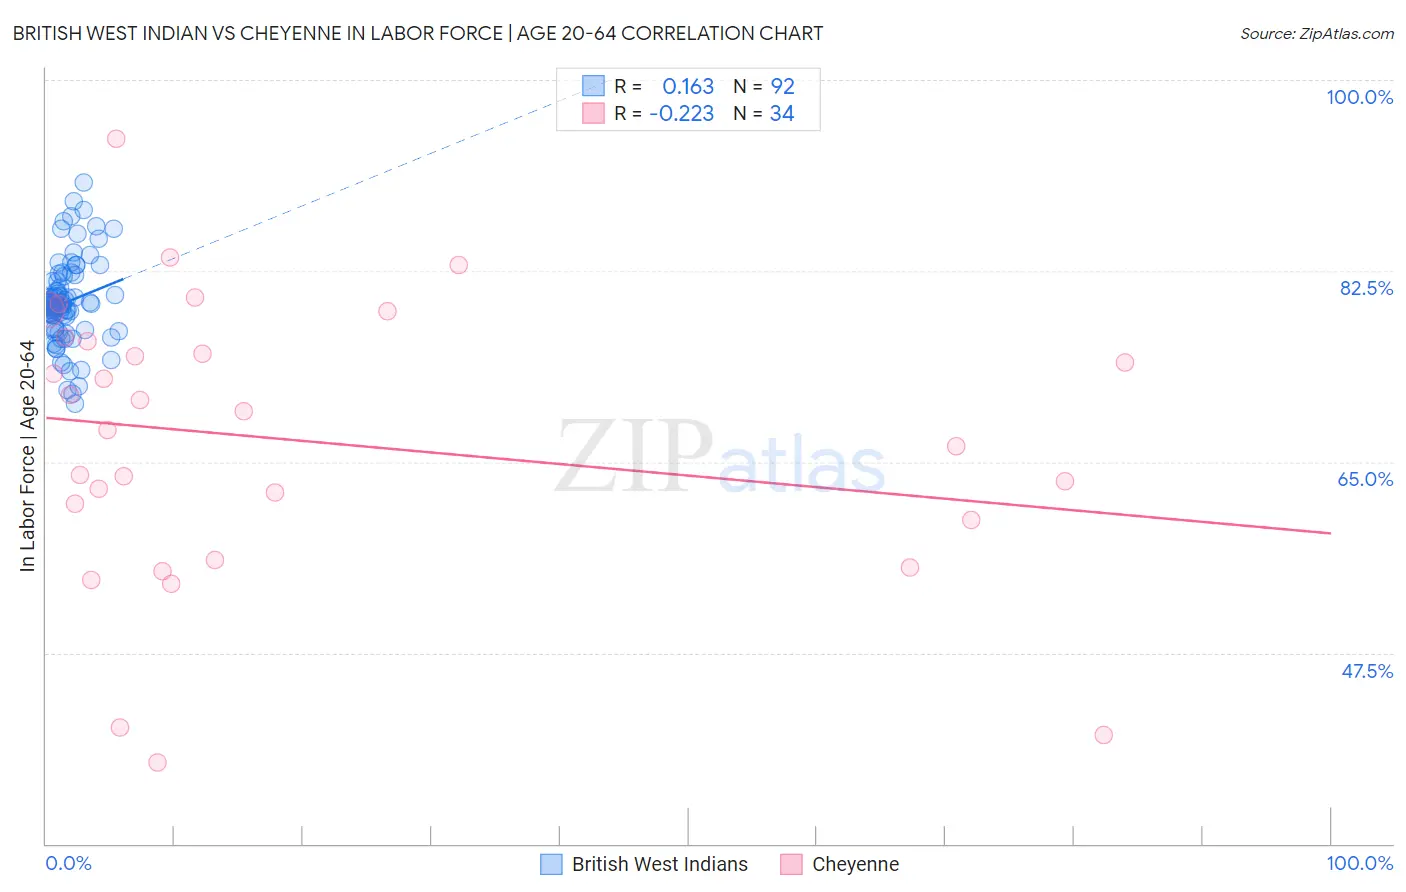
British West Indian vs Cheyenne In Labor Force | Age 20-64 Correlation Chart
The statistical analysis conducted on geographies consisting of 152,617,449 people shows a poor positive correlation between the proportion of British West Indians and labor force participation rate among population between the ages 20 and 64 in the United States with a correlation coefficient (R) of 0.163 and weighted average of 78.4%. Similarly, the statistical analysis conducted on geographies consisting of 80,710,794 people shows a weak negative correlation between the proportion of Cheyenne and labor force participation rate among population between the ages 20 and 64 in the United States with a correlation coefficient (R) of -0.223 and weighted average of 74.8%, a difference of 4.7%.
In Labor Force | Age 20-64 Correlation Summary
| Measurement | British West Indian | Cheyenne |
| Minimum | 70.3% | 37.5% |
| Maximum | 90.6% | 94.6% |
| Range | 20.3% | 57.1% |
| Mean | 79.6% | 66.9% |
| Median | 79.4% | 68.8% |
| Interquartile 25% (IQ1) | 77.2% | 59.7% |
| Interquartile 75% (IQ3) | 81.5% | 76.1% |
| Interquartile Range (IQR) | 4.3% | 16.4% |
| Standard Deviation (Sample) | 3.9% | 13.0% |
| Standard Deviation (Population) | 3.9% | 12.8% |
Similar Demographics by In Labor Force | Age 20-64
Demographics Similar to British West Indians by In Labor Force | Age 20-64
In terms of in labor force | age 20-64, the demographic groups most similar to British West Indians are Bahamian (78.4%, a difference of 0.010%), U.S. Virgin Islander (78.4%, a difference of 0.030%), Spaniard (78.4%, a difference of 0.040%), Pennsylvania German (78.4%, a difference of 0.050%), and West Indian (78.3%, a difference of 0.050%).
| Demographics | Rating | Rank | In Labor Force | Age 20-64 |
| Immigrants | Guatemala | 0.4 /100 | #258 | Tragic 78.7% |
| Tsimshian | 0.4 /100 | #259 | Tragic 78.7% |
| Immigrants | Fiji | 0.3 /100 | #260 | Tragic 78.6% |
| Whites/Caucasians | 0.2 /100 | #261 | Tragic 78.5% |
| Fijians | 0.1 /100 | #262 | Tragic 78.4% |
| Pennsylvania Germans | 0.1 /100 | #263 | Tragic 78.4% |
| Spaniards | 0.1 /100 | #264 | Tragic 78.4% |
| British West Indians | 0.1 /100 | #265 | Tragic 78.4% |
| Bahamians | 0.1 /100 | #266 | Tragic 78.4% |
| U.S. Virgin Islanders | 0.1 /100 | #267 | Tragic 78.4% |
| West Indians | 0.0 /100 | #268 | Tragic 78.3% |
| Immigrants | Barbados | 0.0 /100 | #269 | Tragic 78.3% |
| Scotch-Irish | 0.0 /100 | #270 | Tragic 78.3% |
| Immigrants | Latin America | 0.0 /100 | #271 | Tragic 78.3% |
| Marshallese | 0.0 /100 | #272 | Tragic 78.3% |
Demographics Similar to Cheyenne by In Labor Force | Age 20-64
In terms of in labor force | age 20-64, the demographic groups most similar to Cheyenne are Colville (74.8%, a difference of 0.070%), Kiowa (75.0%, a difference of 0.20%), Paiute (74.7%, a difference of 0.20%), Sioux (75.0%, a difference of 0.23%), and Creek (75.1%, a difference of 0.40%).
| Demographics | Rating | Rank | In Labor Force | Age 20-64 |
| Dutch West Indians | 0.0 /100 | #322 | Tragic 75.5% |
| Cajuns | 0.0 /100 | #323 | Tragic 75.5% |
| Choctaw | 0.0 /100 | #324 | Tragic 75.4% |
| Menominee | 0.0 /100 | #325 | Tragic 75.3% |
| Creek | 0.0 /100 | #326 | Tragic 75.1% |
| Sioux | 0.0 /100 | #327 | Tragic 75.0% |
| Kiowa | 0.0 /100 | #328 | Tragic 75.0% |
| Cheyenne | 0.0 /100 | #329 | Tragic 74.8% |
| Colville | 0.0 /100 | #330 | Tragic 74.8% |
| Paiute | 0.0 /100 | #331 | Tragic 74.7% |
| Arapaho | 0.0 /100 | #332 | Tragic 74.4% |
| Natives/Alaskans | 0.0 /100 | #333 | Tragic 73.9% |
| Apache | 0.0 /100 | #334 | Tragic 73.7% |
| Ute | 0.0 /100 | #335 | Tragic 73.7% |
| Crow | 0.0 /100 | #336 | Tragic 73.3% |