American vs Immigrants from Nepal In Labor Force | Age > 16
COMPARE
American
Immigrants from Nepal
In Labor Force | Age > 16
In Labor Force | Age > 16 Comparison
Americans
Immigrants from Nepal
62.1%
IN LABOR FORCE | AGE > 16
0.0/ 100
METRIC RATING
321st/ 347
METRIC RANK
68.0%
IN LABOR FORCE | AGE > 16
100.0/ 100
METRIC RATING
13th/ 347
METRIC RANK
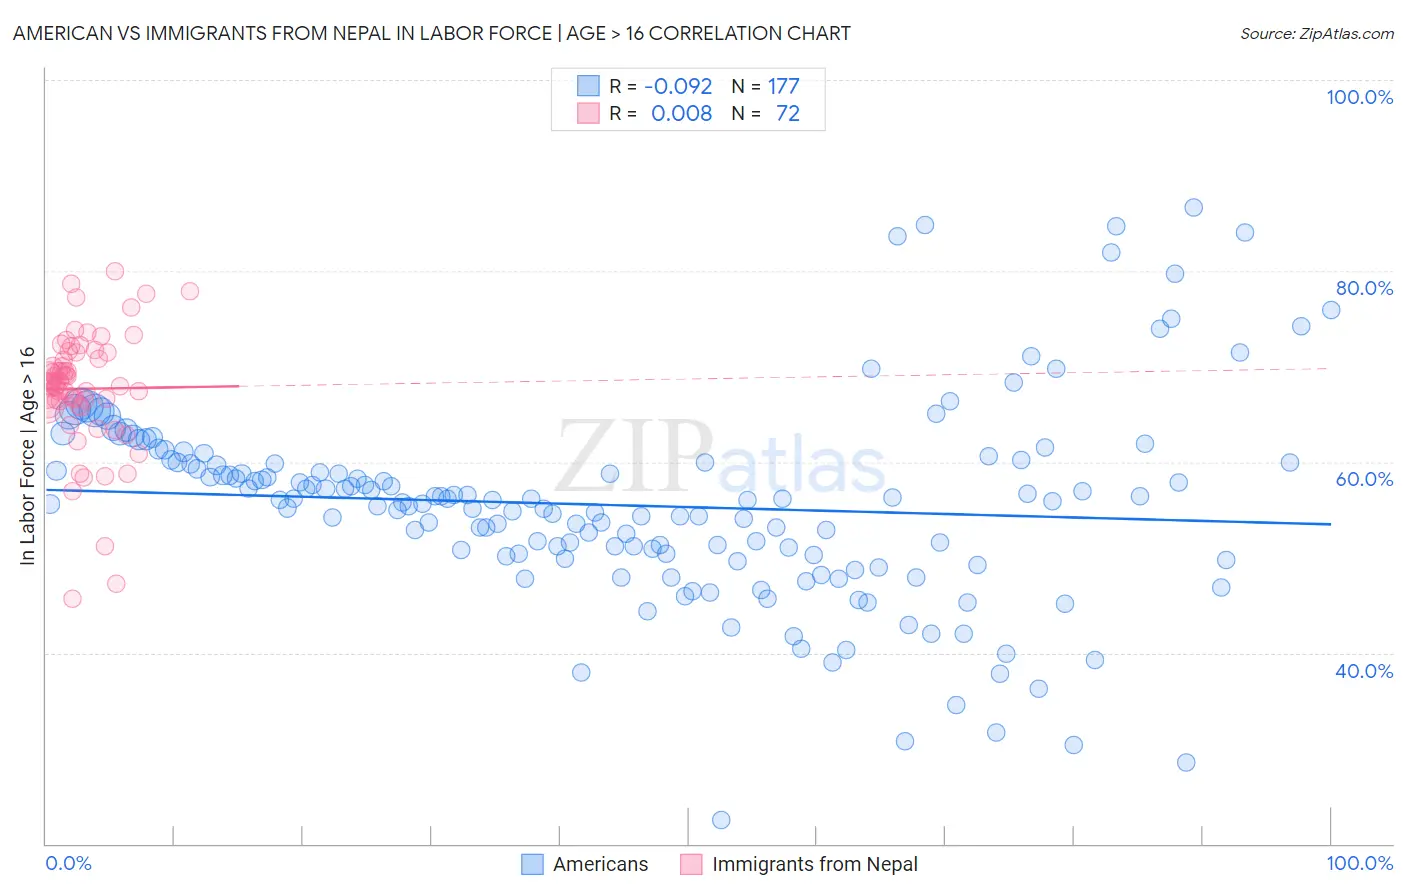
American vs Immigrants from Nepal In Labor Force | Age > 16 Correlation Chart
The statistical analysis conducted on geographies consisting of 581,977,870 people shows a slight negative correlation between the proportion of Americans and labor force participation rate among population ages 16 and over in the United States with a correlation coefficient (R) of -0.092 and weighted average of 62.1%. Similarly, the statistical analysis conducted on geographies consisting of 186,792,250 people shows no correlation between the proportion of Immigrants from Nepal and labor force participation rate among population ages 16 and over in the United States with a correlation coefficient (R) of 0.008 and weighted average of 68.0%, a difference of 9.5%.
In Labor Force | Age > 16 Correlation Summary
| Measurement | American | Immigrants from Nepal |
| Minimum | 22.4% | 45.6% |
| Maximum | 86.7% | 80.0% |
| Range | 64.3% | 34.4% |
| Mean | 55.4% | 67.7% |
| Median | 56.0% | 68.3% |
| Interquartile 25% (IQ1) | 50.2% | 66.1% |
| Interquartile 75% (IQ3) | 59.9% | 71.1% |
| Interquartile Range (IQR) | 9.8% | 5.0% |
| Standard Deviation (Sample) | 10.5% | 6.3% |
| Standard Deviation (Population) | 10.4% | 6.2% |
Similar Demographics by In Labor Force | Age > 16
Demographics Similar to Americans by In Labor Force | Age > 16
In terms of in labor force | age > 16, the demographic groups most similar to Americans are Arapaho (62.1%, a difference of 0.040%), Yakama (62.1%, a difference of 0.040%), Ottawa (62.0%, a difference of 0.16%), Seminole (62.0%, a difference of 0.18%), and Cheyenne (62.0%, a difference of 0.22%).
| Demographics | Rating | Rank | In Labor Force | Age > 16 |
| Yaqui | 0.0 /100 | #314 | Tragic 63.0% |
| Potawatomi | 0.0 /100 | #315 | Tragic 62.8% |
| Yup'ik | 0.0 /100 | #316 | Tragic 62.7% |
| Kiowa | 0.0 /100 | #317 | Tragic 62.4% |
| Chickasaw | 0.0 /100 | #318 | Tragic 62.3% |
| Arapaho | 0.0 /100 | #319 | Tragic 62.1% |
| Yakama | 0.0 /100 | #320 | Tragic 62.1% |
| Americans | 0.0 /100 | #321 | Tragic 62.1% |
| Ottawa | 0.0 /100 | #322 | Tragic 62.0% |
| Seminole | 0.0 /100 | #323 | Tragic 62.0% |
| Cheyenne | 0.0 /100 | #324 | Tragic 62.0% |
| Cherokee | 0.0 /100 | #325 | Tragic 61.9% |
| Sioux | 0.0 /100 | #326 | Tragic 61.8% |
| Cajuns | 0.0 /100 | #327 | Tragic 61.8% |
| Dutch West Indians | 0.0 /100 | #328 | Tragic 61.7% |
Demographics Similar to Immigrants from Nepal by In Labor Force | Age > 16
In terms of in labor force | age > 16, the demographic groups most similar to Immigrants from Nepal are Sudanese (68.0%, a difference of 0.020%), Bolivian (68.2%, a difference of 0.24%), Liberian (67.8%, a difference of 0.36%), Immigrants from Middle Africa (67.7%, a difference of 0.42%), and Immigrants from Sudan (67.7%, a difference of 0.53%).
| Demographics | Rating | Rank | In Labor Force | Age > 16 |
| Immigrants | Eritrea | 100.0 /100 | #6 | Exceptional 68.9% |
| Immigrants | Cameroon | 100.0 /100 | #7 | Exceptional 68.7% |
| Immigrants | Sierra Leone | 100.0 /100 | #8 | Exceptional 68.5% |
| Immigrants | Eastern Africa | 100.0 /100 | #9 | Exceptional 68.5% |
| Immigrants | Bolivia | 100.0 /100 | #10 | Exceptional 68.4% |
| Bolivians | 100.0 /100 | #11 | Exceptional 68.2% |
| Sudanese | 100.0 /100 | #12 | Exceptional 68.0% |
| Immigrants | Nepal | 100.0 /100 | #13 | Exceptional 68.0% |
| Liberians | 100.0 /100 | #14 | Exceptional 67.8% |
| Immigrants | Middle Africa | 100.0 /100 | #15 | Exceptional 67.7% |
| Immigrants | Sudan | 100.0 /100 | #16 | Exceptional 67.7% |
| Immigrants | India | 100.0 /100 | #17 | Exceptional 67.6% |
| Immigrants | Liberia | 100.0 /100 | #18 | Exceptional 67.6% |
| Kenyans | 100.0 /100 | #19 | Exceptional 67.6% |
| Immigrants | Kenya | 100.0 /100 | #20 | Exceptional 67.6% |