Osage vs Immigrants from Nepal In Labor Force | Age > 16
COMPARE
Osage
Immigrants from Nepal
In Labor Force | Age > 16
In Labor Force | Age > 16 Comparison
Osage
Immigrants from Nepal
63.5%
IN LABOR FORCE | AGE > 16
0.0/ 100
METRIC RATING
305th/ 347
METRIC RANK
68.0%
IN LABOR FORCE | AGE > 16
100.0/ 100
METRIC RATING
13th/ 347
METRIC RANK
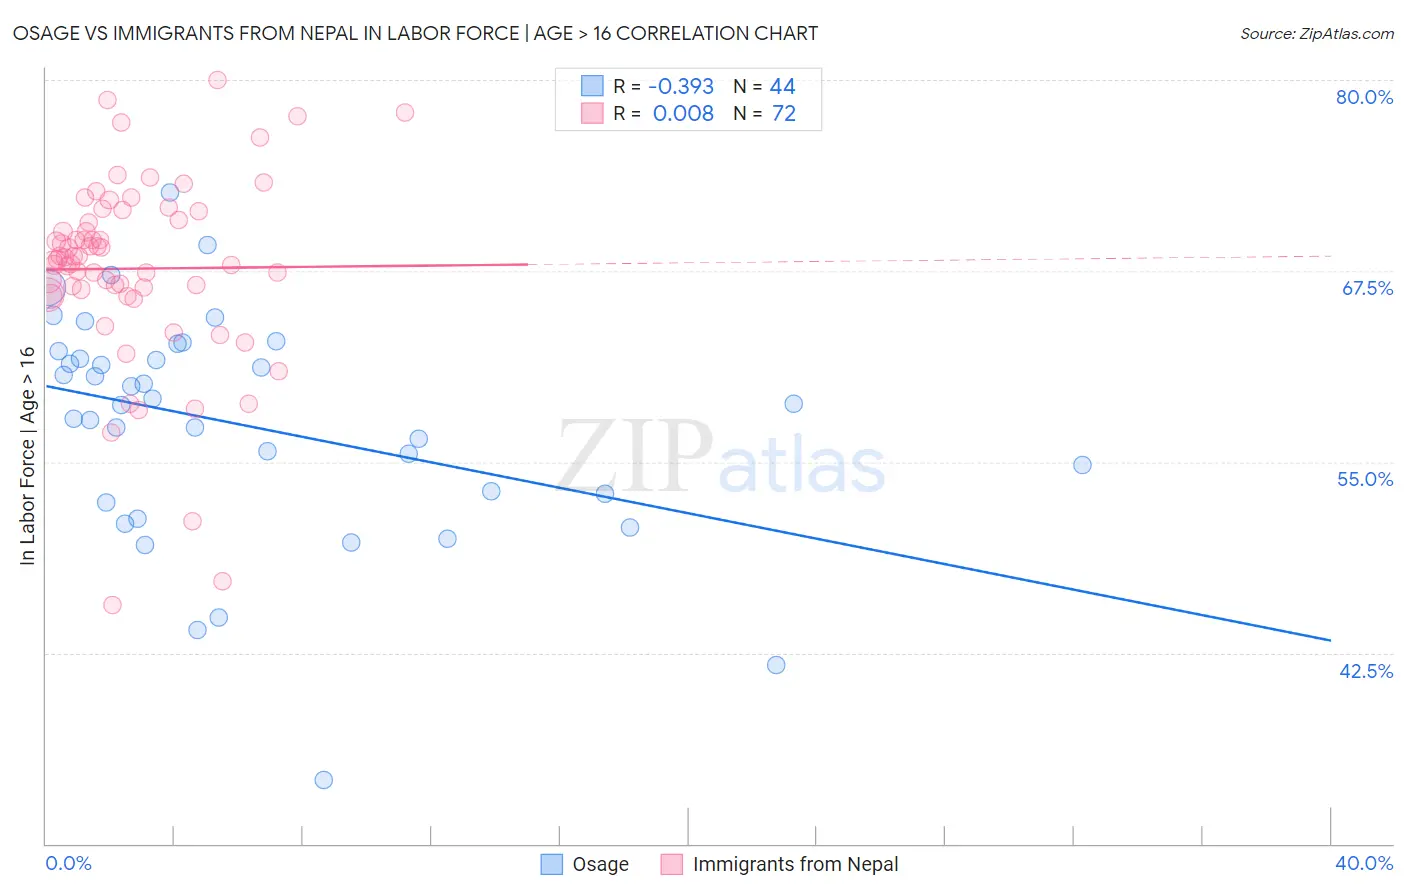
Osage vs Immigrants from Nepal In Labor Force | Age > 16 Correlation Chart
The statistical analysis conducted on geographies consisting of 91,805,602 people shows a mild negative correlation between the proportion of Osage and labor force participation rate among population ages 16 and over in the United States with a correlation coefficient (R) of -0.393 and weighted average of 63.5%. Similarly, the statistical analysis conducted on geographies consisting of 186,792,250 people shows no correlation between the proportion of Immigrants from Nepal and labor force participation rate among population ages 16 and over in the United States with a correlation coefficient (R) of 0.008 and weighted average of 68.0%, a difference of 7.2%.
In Labor Force | Age > 16 Correlation Summary
| Measurement | Osage | Immigrants from Nepal |
| Minimum | 34.2% | 45.6% |
| Maximum | 72.7% | 80.0% |
| Range | 38.5% | 34.4% |
| Mean | 57.3% | 67.7% |
| Median | 58.8% | 68.3% |
| Interquartile 25% (IQ1) | 52.6% | 66.1% |
| Interquartile 75% (IQ3) | 62.0% | 71.1% |
| Interquartile Range (IQR) | 9.4% | 5.0% |
| Standard Deviation (Sample) | 7.5% | 6.3% |
| Standard Deviation (Population) | 7.4% | 6.2% |
Similar Demographics by In Labor Force | Age > 16
Demographics Similar to Osage by In Labor Force | Age > 16
In terms of in labor force | age > 16, the demographic groups most similar to Osage are Nonimmigrants (63.5%, a difference of 0.050%), Black/African American (63.4%, a difference of 0.090%), Cree (63.5%, a difference of 0.10%), Central American Indian (63.4%, a difference of 0.13%), and Delaware (63.6%, a difference of 0.14%).
| Demographics | Rating | Rank | In Labor Force | Age > 16 |
| Comanche | 0.0 /100 | #298 | Tragic 63.6% |
| Whites/Caucasians | 0.0 /100 | #299 | Tragic 63.6% |
| Immigrants | Azores | 0.0 /100 | #300 | Tragic 63.6% |
| Spanish Americans | 0.0 /100 | #301 | Tragic 63.6% |
| Delaware | 0.0 /100 | #302 | Tragic 63.6% |
| Cree | 0.0 /100 | #303 | Tragic 63.5% |
| Immigrants | Nonimmigrants | 0.0 /100 | #304 | Tragic 63.5% |
| Osage | 0.0 /100 | #305 | Tragic 63.5% |
| Blacks/African Americans | 0.0 /100 | #306 | Tragic 63.4% |
| Central American Indians | 0.0 /100 | #307 | Tragic 63.4% |
| Pennsylvania Germans | 0.0 /100 | #308 | Tragic 63.4% |
| Scotch-Irish | 0.0 /100 | #309 | Tragic 63.3% |
| Shoshone | 0.0 /100 | #310 | Tragic 63.2% |
| Blackfeet | 0.0 /100 | #311 | Tragic 63.2% |
| Iroquois | 0.0 /100 | #312 | Tragic 63.2% |
Demographics Similar to Immigrants from Nepal by In Labor Force | Age > 16
In terms of in labor force | age > 16, the demographic groups most similar to Immigrants from Nepal are Sudanese (68.0%, a difference of 0.020%), Bolivian (68.2%, a difference of 0.24%), Liberian (67.8%, a difference of 0.36%), Immigrants from Middle Africa (67.7%, a difference of 0.42%), and Immigrants from Sudan (67.7%, a difference of 0.53%).
| Demographics | Rating | Rank | In Labor Force | Age > 16 |
| Immigrants | Eritrea | 100.0 /100 | #6 | Exceptional 68.9% |
| Immigrants | Cameroon | 100.0 /100 | #7 | Exceptional 68.7% |
| Immigrants | Sierra Leone | 100.0 /100 | #8 | Exceptional 68.5% |
| Immigrants | Eastern Africa | 100.0 /100 | #9 | Exceptional 68.5% |
| Immigrants | Bolivia | 100.0 /100 | #10 | Exceptional 68.4% |
| Bolivians | 100.0 /100 | #11 | Exceptional 68.2% |
| Sudanese | 100.0 /100 | #12 | Exceptional 68.0% |
| Immigrants | Nepal | 100.0 /100 | #13 | Exceptional 68.0% |
| Liberians | 100.0 /100 | #14 | Exceptional 67.8% |
| Immigrants | Middle Africa | 100.0 /100 | #15 | Exceptional 67.7% |
| Immigrants | Sudan | 100.0 /100 | #16 | Exceptional 67.7% |
| Immigrants | India | 100.0 /100 | #17 | Exceptional 67.6% |
| Immigrants | Liberia | 100.0 /100 | #18 | Exceptional 67.6% |
| Kenyans | 100.0 /100 | #19 | Exceptional 67.6% |
| Immigrants | Kenya | 100.0 /100 | #20 | Exceptional 67.6% |