American vs Immigrants from Nepal Unemployment Among Women with Children Under 18 years
COMPARE
American
Immigrants from Nepal
Unemployment Among Women with Children Under 18 years
Unemployment Among Women with Children Under 18 years Comparison
Americans
Immigrants from Nepal
5.7%
UNEMPLOYMENT AMONG WOMEN WITH CHILDREN UNDER 18 YEARS
8.9/ 100
METRIC RATING
213th/ 347
METRIC RANK
5.1%
UNEMPLOYMENT AMONG WOMEN WITH CHILDREN UNDER 18 YEARS
98.3/ 100
METRIC RATING
52nd/ 347
METRIC RANK
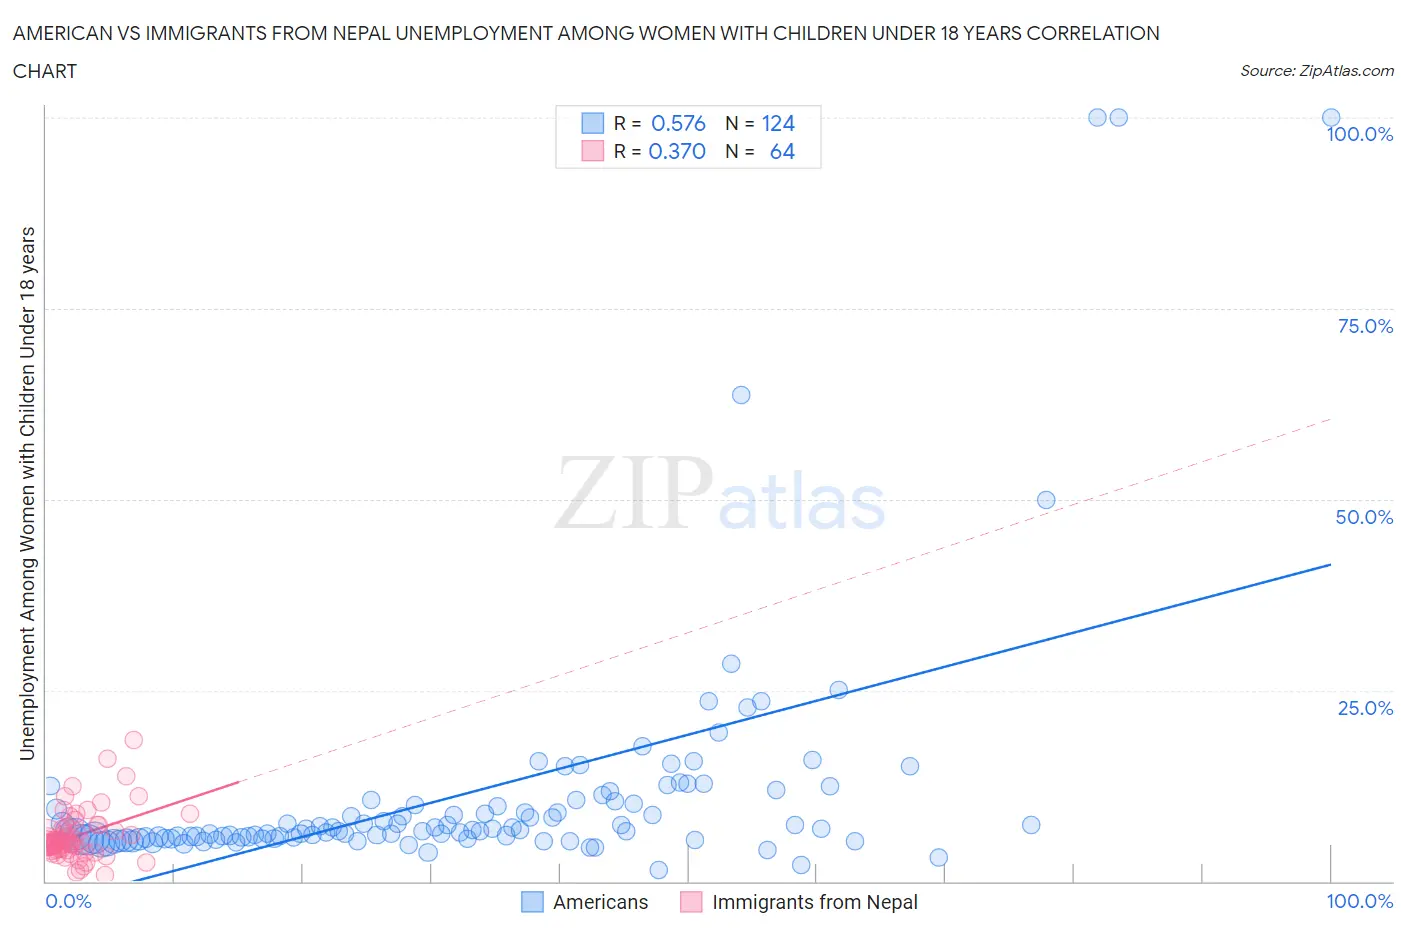
American vs Immigrants from Nepal Unemployment Among Women with Children Under 18 years Correlation Chart
The statistical analysis conducted on geographies consisting of 522,512,550 people shows a substantial positive correlation between the proportion of Americans and unemployment rate among women with children under the age of 18 in the United States with a correlation coefficient (R) of 0.576 and weighted average of 5.7%. Similarly, the statistical analysis conducted on geographies consisting of 183,235,673 people shows a mild positive correlation between the proportion of Immigrants from Nepal and unemployment rate among women with children under the age of 18 in the United States with a correlation coefficient (R) of 0.370 and weighted average of 5.1%, a difference of 12.2%.
Unemployment Among Women with Children Under 18 years Correlation Summary
| Measurement | American | Immigrants from Nepal |
| Minimum | 1.5% | 0.90% |
| Maximum | 100.0% | 18.5% |
| Range | 98.5% | 17.6% |
| Mean | 11.4% | 6.0% |
| Median | 6.6% | 5.2% |
| Interquartile 25% (IQ1) | 5.6% | 4.1% |
| Interquartile 75% (IQ3) | 10.3% | 7.0% |
| Interquartile Range (IQR) | 4.7% | 2.9% |
| Standard Deviation (Sample) | 16.0% | 3.3% |
| Standard Deviation (Population) | 15.9% | 3.3% |
Similar Demographics by Unemployment Among Women with Children Under 18 years
Demographics Similar to Americans by Unemployment Among Women with Children Under 18 years
In terms of unemployment among women with children under 18 years, the demographic groups most similar to Americans are Japanese (5.7%, a difference of 0.040%), South American (5.7%, a difference of 0.22%), Panamanian (5.7%, a difference of 0.23%), Immigrants from Uganda (5.7%, a difference of 0.23%), and Nonimmigrants (5.7%, a difference of 0.34%).
| Demographics | Rating | Rank | Unemployment Among Women with Children Under 18 years |
| Nicaraguans | 12.3 /100 | #206 | Poor 5.6% |
| Peruvians | 12.1 /100 | #207 | Poor 5.6% |
| Immigrants | Costa Rica | 11.6 /100 | #208 | Poor 5.6% |
| Immigrants | Western Asia | 11.3 /100 | #209 | Poor 5.6% |
| Immigrants | Nonimmigrants | 10.6 /100 | #210 | Poor 5.7% |
| Panamanians | 10.1 /100 | #211 | Poor 5.7% |
| South Americans | 10.0 /100 | #212 | Poor 5.7% |
| Americans | 8.9 /100 | #213 | Tragic 5.7% |
| Japanese | 8.7 /100 | #214 | Tragic 5.7% |
| Immigrants | Uganda | 7.9 /100 | #215 | Tragic 5.7% |
| Immigrants | Peru | 7.4 /100 | #216 | Tragic 5.7% |
| Immigrants | Brazil | 7.1 /100 | #217 | Tragic 5.7% |
| Immigrants | Nicaragua | 7.0 /100 | #218 | Tragic 5.7% |
| Iroquois | 6.5 /100 | #219 | Tragic 5.7% |
| Immigrants | Fiji | 6.3 /100 | #220 | Tragic 5.7% |
Demographics Similar to Immigrants from Nepal by Unemployment Among Women with Children Under 18 years
In terms of unemployment among women with children under 18 years, the demographic groups most similar to Immigrants from Nepal are Yugoslavian (5.1%, a difference of 0.0%), Immigrants from Japan (5.0%, a difference of 0.080%), Scottish (5.1%, a difference of 0.090%), Lithuanian (5.0%, a difference of 0.11%), and Immigrants from Serbia (5.1%, a difference of 0.12%).
| Demographics | Rating | Rank | Unemployment Among Women with Children Under 18 years |
| Immigrants | Malaysia | 98.8 /100 | #45 | Exceptional 5.0% |
| Immigrants | Korea | 98.7 /100 | #46 | Exceptional 5.0% |
| British | 98.7 /100 | #47 | Exceptional 5.0% |
| Northern Europeans | 98.6 /100 | #48 | Exceptional 5.0% |
| Lithuanians | 98.4 /100 | #49 | Exceptional 5.0% |
| Immigrants | Japan | 98.4 /100 | #50 | Exceptional 5.0% |
| Yugoslavians | 98.3 /100 | #51 | Exceptional 5.1% |
| Immigrants | Nepal | 98.3 /100 | #52 | Exceptional 5.1% |
| Scottish | 98.2 /100 | #53 | Exceptional 5.1% |
| Immigrants | Serbia | 98.2 /100 | #54 | Exceptional 5.1% |
| Immigrants | Sri Lanka | 98.1 /100 | #55 | Exceptional 5.1% |
| Immigrants | Ireland | 98.0 /100 | #56 | Exceptional 5.1% |
| Czechoslovakians | 98.0 /100 | #57 | Exceptional 5.1% |
| Immigrants | Belgium | 97.9 /100 | #58 | Exceptional 5.1% |
| Asians | 97.9 /100 | #59 | Exceptional 5.1% |