American vs Immigrants from Nepal Family Households
COMPARE
American
Immigrants from Nepal
Family Households
Family Households Comparison
Americans
Immigrants from Nepal
65.5%
FAMILY HOUSEHOLDS
99.6/ 100
METRIC RATING
84th/ 347
METRIC RANK
62.7%
FAMILY HOUSEHOLDS
0.1/ 100
METRIC RATING
289th/ 347
METRIC RANK
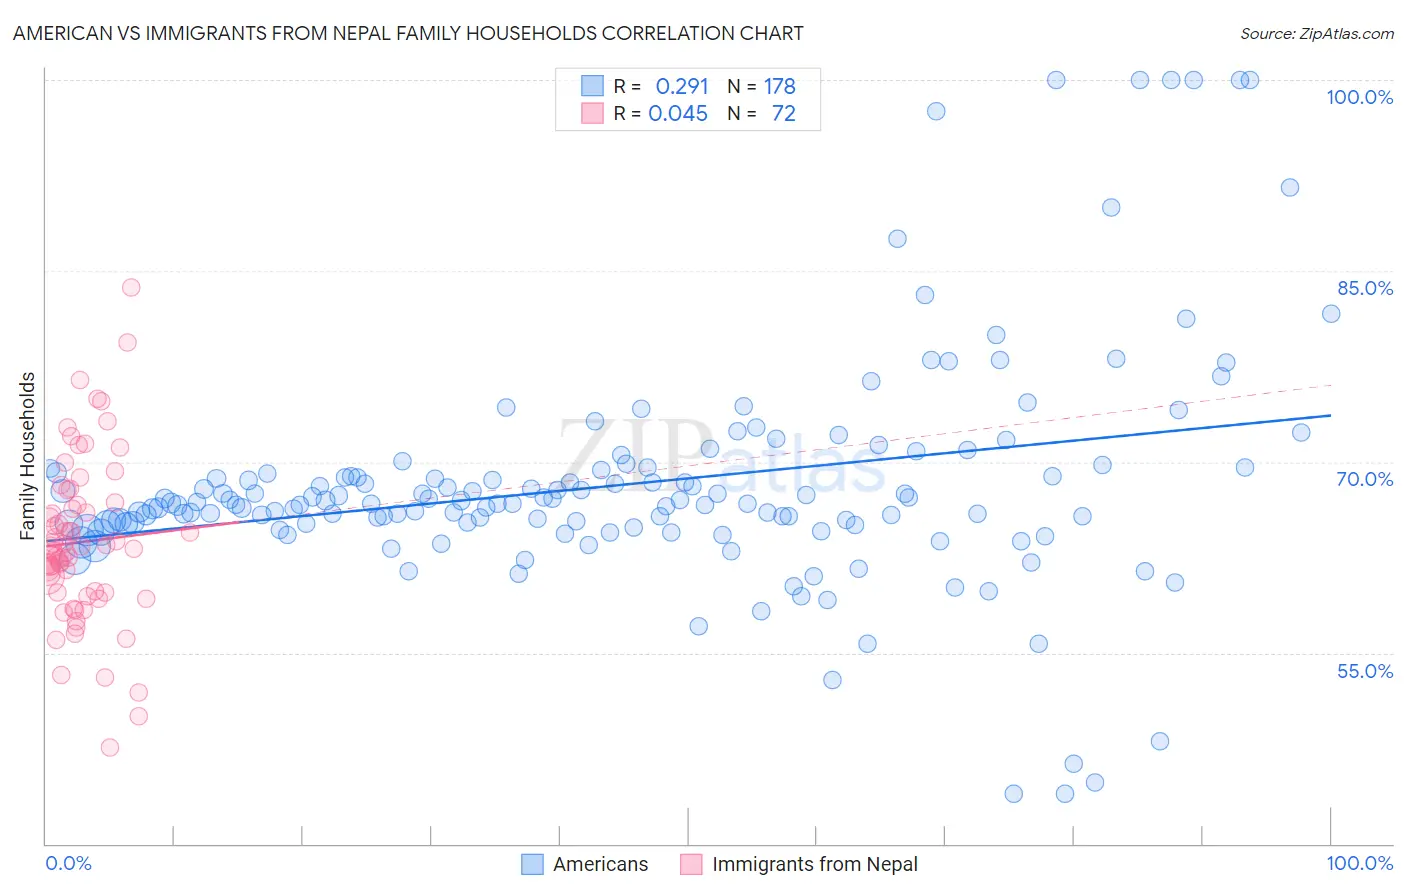
American vs Immigrants from Nepal Family Households Correlation Chart
The statistical analysis conducted on geographies consisting of 581,387,036 people shows a weak positive correlation between the proportion of Americans and percentage of family households in the United States with a correlation coefficient (R) of 0.291 and weighted average of 65.5%. Similarly, the statistical analysis conducted on geographies consisting of 186,706,837 people shows no correlation between the proportion of Immigrants from Nepal and percentage of family households in the United States with a correlation coefficient (R) of 0.045 and weighted average of 62.7%, a difference of 4.5%.
Family Households Correlation Summary
| Measurement | American | Immigrants from Nepal |
| Minimum | 43.9% | 47.6% |
| Maximum | 100.0% | 83.7% |
| Range | 56.1% | 36.1% |
| Mean | 68.2% | 63.7% |
| Median | 66.7% | 63.3% |
| Interquartile 25% (IQ1) | 65.1% | 59.7% |
| Interquartile 75% (IQ3) | 69.3% | 66.7% |
| Interquartile Range (IQR) | 4.2% | 7.0% |
| Standard Deviation (Sample) | 9.1% | 6.5% |
| Standard Deviation (Population) | 9.1% | 6.4% |
Similar Demographics by Family Households
Demographics Similar to Americans by Family Households
In terms of family households, the demographic groups most similar to Americans are Immigrants from Guyana (65.5%, a difference of 0.020%), Immigrants from Lebanon (65.5%, a difference of 0.030%), Jordanian (65.5%, a difference of 0.060%), Immigrants from Cambodia (65.4%, a difference of 0.11%), and Puget Sound Salish (65.6%, a difference of 0.14%).
| Demographics | Rating | Rank | Family Households |
| Immigrants | South America | 99.8 /100 | #77 | Exceptional 65.6% |
| Yaqui | 99.8 /100 | #78 | Exceptional 65.6% |
| Immigrants | Costa Rica | 99.8 /100 | #79 | Exceptional 65.6% |
| Puget Sound Salish | 99.8 /100 | #80 | Exceptional 65.6% |
| Jordanians | 99.7 /100 | #81 | Exceptional 65.5% |
| Immigrants | Lebanon | 99.7 /100 | #82 | Exceptional 65.5% |
| Immigrants | Guyana | 99.6 /100 | #83 | Exceptional 65.5% |
| Americans | 99.6 /100 | #84 | Exceptional 65.5% |
| Immigrants | Cambodia | 99.5 /100 | #85 | Exceptional 65.4% |
| Egyptians | 99.4 /100 | #86 | Exceptional 65.4% |
| Immigrants | Egypt | 99.2 /100 | #87 | Exceptional 65.3% |
| Immigrants | Haiti | 99.1 /100 | #88 | Exceptional 65.3% |
| Immigrants | Caribbean | 99.1 /100 | #89 | Exceptional 65.3% |
| Immigrants | Laos | 99.1 /100 | #90 | Exceptional 65.3% |
| Crow | 98.9 /100 | #91 | Exceptional 65.3% |
Demographics Similar to Immigrants from Nepal by Family Households
In terms of family households, the demographic groups most similar to Immigrants from Nepal are Immigrants from Grenada (62.6%, a difference of 0.080%), Immigrants from Uganda (62.7%, a difference of 0.090%), British West Indian (62.8%, a difference of 0.11%), Latvian (62.8%, a difference of 0.11%), and U.S. Virgin Islander (62.6%, a difference of 0.13%).
| Demographics | Rating | Rank | Family Households |
| New Zealanders | 0.1 /100 | #282 | Tragic 62.9% |
| Immigrants | Denmark | 0.1 /100 | #283 | Tragic 62.9% |
| Australians | 0.1 /100 | #284 | Tragic 62.8% |
| Mongolians | 0.1 /100 | #285 | Tragic 62.8% |
| British West Indians | 0.1 /100 | #286 | Tragic 62.8% |
| Latvians | 0.1 /100 | #287 | Tragic 62.8% |
| Immigrants | Uganda | 0.1 /100 | #288 | Tragic 62.7% |
| Immigrants | Nepal | 0.1 /100 | #289 | Tragic 62.7% |
| Immigrants | Grenada | 0.0 /100 | #290 | Tragic 62.6% |
| U.S. Virgin Islanders | 0.0 /100 | #291 | Tragic 62.6% |
| Immigrants | Burma/Myanmar | 0.0 /100 | #292 | Tragic 62.6% |
| Immigrants | Sweden | 0.0 /100 | #293 | Tragic 62.5% |
| Barbadians | 0.0 /100 | #294 | Tragic 62.5% |
| Okinawans | 0.0 /100 | #295 | Tragic 62.5% |
| Slovenes | 0.0 /100 | #296 | Tragic 62.4% |