Aleut vs Immigrants from Belgium In Labor Force | Age 45-54
COMPARE
Aleut
Immigrants from Belgium
In Labor Force | Age 45-54
In Labor Force | Age 45-54 Comparison
Aleuts
Immigrants from Belgium
81.0%
IN LABOR FORCE | AGE 45-54
0.0/ 100
METRIC RATING
282nd/ 347
METRIC RANK
83.1%
IN LABOR FORCE | AGE 45-54
86.4/ 100
METRIC RATING
126th/ 347
METRIC RANK
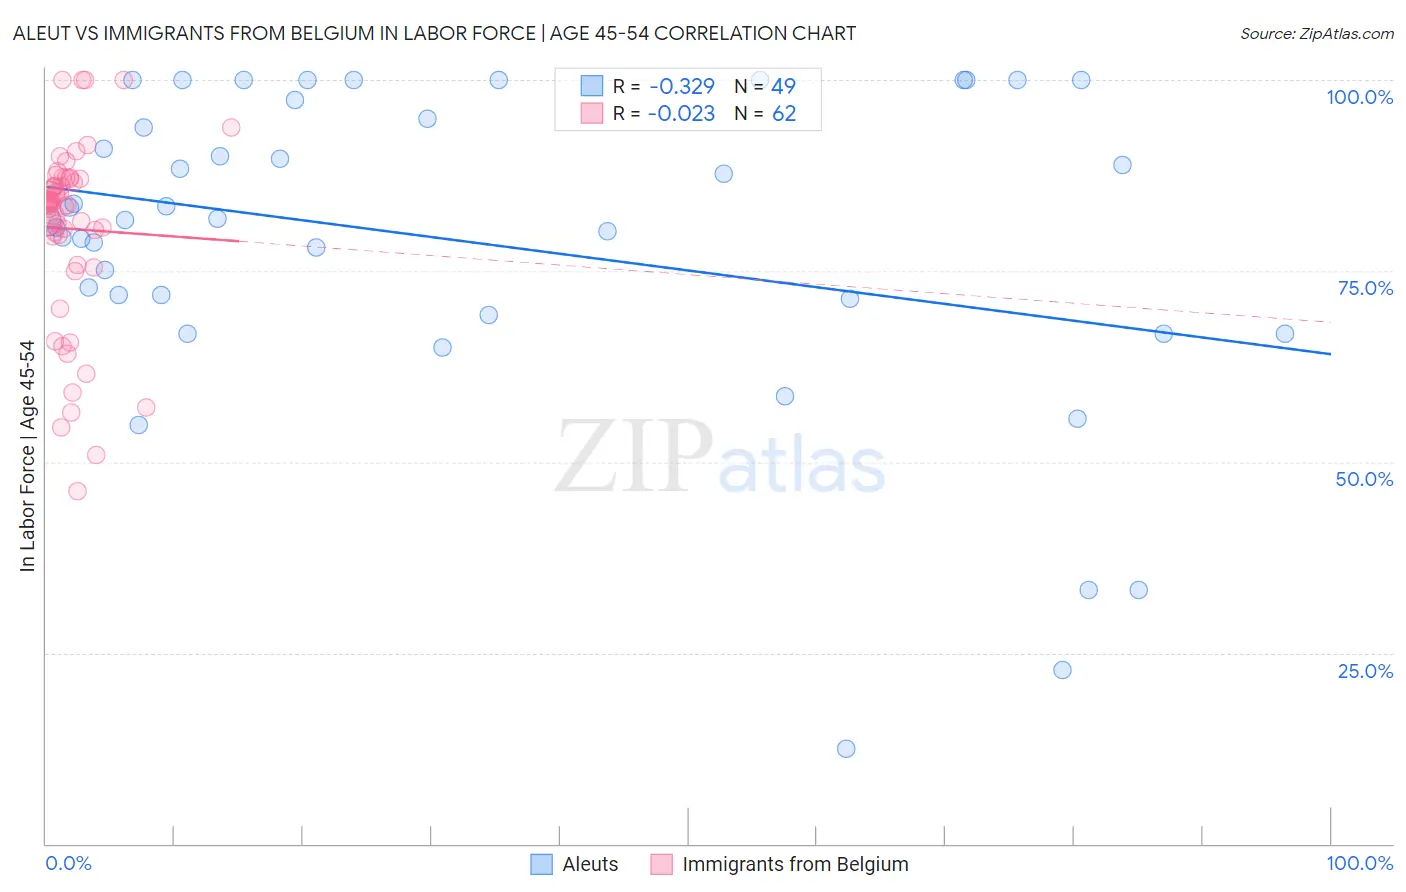
Aleut vs Immigrants from Belgium In Labor Force | Age 45-54 Correlation Chart
The statistical analysis conducted on geographies consisting of 61,774,977 people shows a mild negative correlation between the proportion of Aleuts and labor force participation rate among population between the ages 45 and 54 in the United States with a correlation coefficient (R) of -0.329 and weighted average of 81.0%. Similarly, the statistical analysis conducted on geographies consisting of 146,695,450 people shows no correlation between the proportion of Immigrants from Belgium and labor force participation rate among population between the ages 45 and 54 in the United States with a correlation coefficient (R) of -0.023 and weighted average of 83.1%, a difference of 2.6%.
In Labor Force | Age 45-54 Correlation Summary
| Measurement | Aleut | Immigrants from Belgium |
| Minimum | 12.5% | 46.2% |
| Maximum | 100.0% | 100.0% |
| Range | 87.5% | 53.8% |
| Mean | 78.8% | 80.5% |
| Median | 81.6% | 83.9% |
| Interquartile 25% (IQ1) | 70.3% | 79.6% |
| Interquartile 75% (IQ3) | 96.2% | 87.0% |
| Interquartile Range (IQR) | 25.9% | 7.4% |
| Standard Deviation (Sample) | 20.7% | 11.9% |
| Standard Deviation (Population) | 20.5% | 11.8% |
Similar Demographics by In Labor Force | Age 45-54
Demographics Similar to Aleuts by In Labor Force | Age 45-54
In terms of in labor force | age 45-54, the demographic groups most similar to Aleuts are Immigrants from Latin America (81.0%, a difference of 0.070%), Immigrants from Grenada (81.0%, a difference of 0.070%), French American Indian (80.8%, a difference of 0.17%), Immigrants from Micronesia (81.1%, a difference of 0.18%), and Immigrants from Guatemala (81.1%, a difference of 0.19%).
| Demographics | Rating | Rank | In Labor Force | Age 45-54 |
| Immigrants | Nonimmigrants | 0.0 /100 | #275 | Tragic 81.2% |
| U.S. Virgin Islanders | 0.0 /100 | #276 | Tragic 81.2% |
| Guatemalans | 0.0 /100 | #277 | Tragic 81.2% |
| Immigrants | Guatemala | 0.0 /100 | #278 | Tragic 81.1% |
| Immigrants | Micronesia | 0.0 /100 | #279 | Tragic 81.1% |
| Immigrants | Latin America | 0.0 /100 | #280 | Tragic 81.0% |
| Immigrants | Grenada | 0.0 /100 | #281 | Tragic 81.0% |
| Aleuts | 0.0 /100 | #282 | Tragic 81.0% |
| French American Indians | 0.0 /100 | #283 | Tragic 80.8% |
| Belizeans | 0.0 /100 | #284 | Tragic 80.8% |
| Delaware | 0.0 /100 | #285 | Tragic 80.8% |
| Immigrants | Dominica | 0.0 /100 | #286 | Tragic 80.8% |
| Vietnamese | 0.0 /100 | #287 | Tragic 80.8% |
| Cree | 0.0 /100 | #288 | Tragic 80.8% |
| Immigrants | Bangladesh | 0.0 /100 | #289 | Tragic 80.7% |
Demographics Similar to Immigrants from Belgium by In Labor Force | Age 45-54
In terms of in labor force | age 45-54, the demographic groups most similar to Immigrants from Belgium are Immigrants from Iran (83.1%, a difference of 0.020%), Immigrants from Jordan (83.1%, a difference of 0.020%), German (83.1%, a difference of 0.020%), Immigrants from Northern Europe (83.1%, a difference of 0.020%), and Bermudan (83.1%, a difference of 0.030%).
| Demographics | Rating | Rank | In Labor Force | Age 45-54 |
| Immigrants | Uruguay | 90.2 /100 | #119 | Exceptional 83.2% |
| Immigrants | Russia | 90.1 /100 | #120 | Exceptional 83.2% |
| Uruguayans | 89.4 /100 | #121 | Excellent 83.1% |
| Immigrants | Vietnam | 88.9 /100 | #122 | Excellent 83.1% |
| Tongans | 88.2 /100 | #123 | Excellent 83.1% |
| Bermudans | 88.0 /100 | #124 | Excellent 83.1% |
| Immigrants | Iran | 87.2 /100 | #125 | Excellent 83.1% |
| Immigrants | Belgium | 86.4 /100 | #126 | Excellent 83.1% |
| Immigrants | Jordan | 85.2 /100 | #127 | Excellent 83.1% |
| Germans | 85.1 /100 | #128 | Excellent 83.1% |
| Immigrants | Northern Europe | 85.1 /100 | #129 | Excellent 83.1% |
| Immigrants | Israel | 84.7 /100 | #130 | Excellent 83.1% |
| Finns | 83.3 /100 | #131 | Excellent 83.1% |
| Immigrants | Ukraine | 82.9 /100 | #132 | Excellent 83.0% |
| Liberians | 82.7 /100 | #133 | Excellent 83.0% |