French Canadian vs Immigrants from Belgium In Labor Force | Age 45-54

COMPARE

French Canadian
Race
Ancestry
AfghanAfricanAlaska NativeAlaskan AthabascanAlbanianAleutAlsatianAmericanApacheArabArapahoArgentineanArmenianAssyrian/Chaldean/SyriacAustralianAustrianBahamianBangladeshiBarbadianBasqueBelgianBelizeanBermudanBhutaneseBlackfeetBolivianBrazilianBritishBritish West IndianBulgarianBurmeseCajunCambodianCanadianCape VerdeanCarpatho RusynCelticCentral AmericanCentral American IndianCherokeeCheyenneChickasawChileanChineseChippewaChoctawColombianColvilleComancheCosta RicanCreeCreekCroatianCrowCubanCypriotCzechCzechoslovakianDanishDelawareDominicanDutchDutch West IndianEastern EuropeanEcuadorianEgyptianEnglishEstonianEthiopianEuropeanFijianFilipinoFinnishFrenchFrench American IndianFrench CanadianGermanGerman RussianGhanaianGreekGuamanian/ChamorroGuatemalanGuyaneseHaitianHmongHonduranHopiHoumaHungarianIcelanderIndian (Asian)IndonesianInupiatIranianIraqiIrishIroquoisIsraeliItalianJamaicanJapaneseJordanianKenyanKiowaKoreanLaotianLatvianLebaneseLiberianLithuanianLumbeeLuxembourgerMacedonianMalaysianMalteseMarshalleseMenomineeMexicanMexican American IndianMongolianMoroccanNative HawaiianNavajoNepaleseNew ZealanderNicaraguanNigerianNorthern EuropeanNorwegianOkinawanOsageOttawaPaiutePakistaniPalestinianPanamanianParaguayanPennsylvania GermanPeruvianPimaPolishPortuguesePotawatomiPuebloPuerto RicanPuget Sound SalishRomanianRussianSalvadoranSamoanScandinavianScotch-IrishScottishSeminoleSenegaleseSerbianShoshoneSierra LeoneanSiouxSlavicSlovakSloveneSomaliSouth AfricanSouth AmericanSouth American IndianSoviet UnionSpaniardSpanishSpanish AmericanSpanish American IndianSri LankanSubsaharan AfricanSudaneseSwedishSwissSyrianTaiwaneseThaiTlingit-HaidaTohono O'OdhamTonganTrinidadian and TobagonianTsimshianTurkishU.S. Virgin IslanderUgandanUkrainianUruguayanUteVenezuelanVietnameseWelshWest IndianYakamaYaquiYugoslavianYumanYup'ikZimbabwean
Immigration
NonimmigrantsImmigrantsAfghanistanAfricaAlbaniaArgentinaArmeniaAsiaAustraliaAustriaBahamasBangladeshBarbadosBelarusBelizeBoliviaBosnia and HerzegovinaBrazilBulgariaBurma/MyanmarCabo VerdeCambodiaCameroonCanadaCaribbeanCentral AmericaChileChinaColombiaCongoCosta RicaCroatiaCubaCzechoslovakiaDenmarkDominicaDominican RepublicEastern AfricaEastern AsiaEastern EuropeEcuadorEgyptEl SalvadorEnglandEritreaEthiopiaEuropeFijiFranceGermanyGhanaGreeceGrenadaGuatemalaGuyanaHaitiHondurasHong KongHungaryIndiaIndonesiaIranIraqIrelandIsraelItalyJamaicaJapanJordanKazakhstanKenyaKoreaKuwaitLaosLatin AmericaLatviaLebanonLiberiaLithuaniaMalaysiaMexicoMicronesiaMiddle AfricaMoldovaMoroccoNepalNetherlandsNicaraguaNigeriaNorth AmericaNorth MacedoniaNorthern AfricaNorthern EuropeNorwayOceaniaPakistanPanamaPeruPhilippinesPolandPortugalRomaniaRussiaSaudi ArabiaScotlandSenegalSerbiaSierra LeoneSingaporeSomaliaSouth AfricaSouth AmericaSouth Central AsiaSouth Eastern AsiaSouthern EuropeSpainSri LankaSt. Vincent and the GrenadinesSudanSwedenSwitzerlandSyriaTaiwanThailandTrinidad and TobagoTurkeyUgandaUkraineUruguayUzbekistanVenezuelaVietnamWest IndiesWestern AfricaWestern AsiaWestern EuropeYemenZaireZimbabweAzores
Immigrants from Belgium
Race
Ancestry
AfghanAfricanAlaska NativeAlaskan AthabascanAlbanianAleutAlsatianAmericanApacheArabArapahoArgentineanArmenianAssyrian/Chaldean/SyriacAustralianAustrianBahamianBangladeshiBarbadianBasqueBelgianBelizeanBermudanBhutaneseBlackfeetBolivianBrazilianBritishBritish West IndianBulgarianBurmeseCajunCambodianCanadianCape VerdeanCarpatho RusynCelticCentral AmericanCentral American IndianCherokeeCheyenneChickasawChileanChineseChippewaChoctawColombianColvilleComancheCosta RicanCreeCreekCroatianCrowCubanCypriotCzechCzechoslovakianDanishDelawareDominicanDutchDutch West IndianEastern EuropeanEcuadorianEgyptianEnglishEstonianEthiopianEuropeanFijianFilipinoFinnishFrenchFrench American IndianGermanGerman RussianGhanaianGreekGuamanian/ChamorroGuatemalanGuyaneseHaitianHmongHonduranHopiHoumaHungarianIcelanderIndian (Asian)IndonesianInupiatIranianIraqiIrishIroquoisIsraeliItalianJamaicanJapaneseJordanianKenyanKiowaKoreanLaotianLatvianLebaneseLiberianLithuanianLumbeeLuxembourgerMacedonianMalaysianMalteseMarshalleseMenomineeMexicanMexican American IndianMongolianMoroccanNative HawaiianNavajoNepaleseNew ZealanderNicaraguanNigerianNorthern EuropeanNorwegianOkinawanOsageOttawaPaiutePakistaniPalestinianPanamanianParaguayanPennsylvania GermanPeruvianPimaPolishPortuguesePotawatomiPuebloPuerto RicanPuget Sound SalishRomanianRussianSalvadoranSamoanScandinavianScotch-IrishScottishSeminoleSenegaleseSerbianShoshoneSierra LeoneanSiouxSlavicSlovakSloveneSomaliSouth AfricanSouth AmericanSouth American IndianSoviet UnionSpaniardSpanishSpanish AmericanSpanish American IndianSri LankanSubsaharan AfricanSudaneseSwedishSwissSyrianTaiwaneseThaiTlingit-HaidaTohono O'OdhamTonganTrinidadian and TobagonianTsimshianTurkishU.S. Virgin IslanderUgandanUkrainianUruguayanUteVenezuelanVietnameseWelshWest IndianYakamaYaquiYugoslavianYumanYup'ikZimbabwean
Immigration
NonimmigrantsImmigrantsAfghanistanAfricaAlbaniaArgentinaArmeniaAsiaAustraliaAustriaBahamasBangladeshBarbadosBelarusBelgiumBelizeBoliviaBosnia and HerzegovinaBrazilBulgariaBurma/MyanmarCabo VerdeCambodiaCameroonCanadaCaribbeanCentral AmericaChileChinaColombiaCongoCosta RicaCroatiaCubaCzechoslovakiaDenmarkDominicaDominican RepublicEastern AfricaEastern AsiaEastern EuropeEcuadorEgyptEl SalvadorEnglandEritreaEthiopiaEuropeFijiFranceGermanyGhanaGreeceGrenadaGuatemalaGuyanaHaitiHondurasHong KongHungaryIndiaIndonesiaIranIraqIrelandIsraelItalyJamaicaJapanJordanKazakhstanKenyaKoreaKuwaitLaosLatin AmericaLatviaLebanonLiberiaLithuaniaMalaysiaMexicoMicronesiaMiddle AfricaMoldovaMoroccoNepalNetherlandsNicaraguaNigeriaNorth AmericaNorth MacedoniaNorthern AfricaNorthern EuropeNorwayOceaniaPakistanPanamaPeruPhilippinesPolandPortugalRomaniaRussiaSaudi ArabiaScotlandSenegalSerbiaSierra LeoneSingaporeSomaliaSouth AfricaSouth AmericaSouth Central AsiaSouth Eastern AsiaSouthern EuropeSpainSri LankaSt. Vincent and the GrenadinesSudanSwedenSwitzerlandSyriaTaiwanThailandTrinidad and TobagoTurkeyUgandaUkraineUruguayUzbekistanVenezuelaVietnamWest IndiesWestern AfricaWestern AsiaWestern EuropeYemenZaireZimbabweAzores
In Labor Force | Age 45-54
Income
Poverty
Unemployment
Labor Participation
Family Structure
Vehicle Availability
Education Level
Disability

In Labor Force | Age 45-54 Comparison

French Canadians

Immigrants from Belgium

Poor
Excellent
82.5%
IN LABOR FORCE | AGE 45-54
15.4/ 100
METRIC RATING
200th/ 347
METRIC RANK
83.1%
IN LABOR FORCE | AGE 45-54
86.4/ 100
METRIC RATING
126th/ 347
METRIC RANK

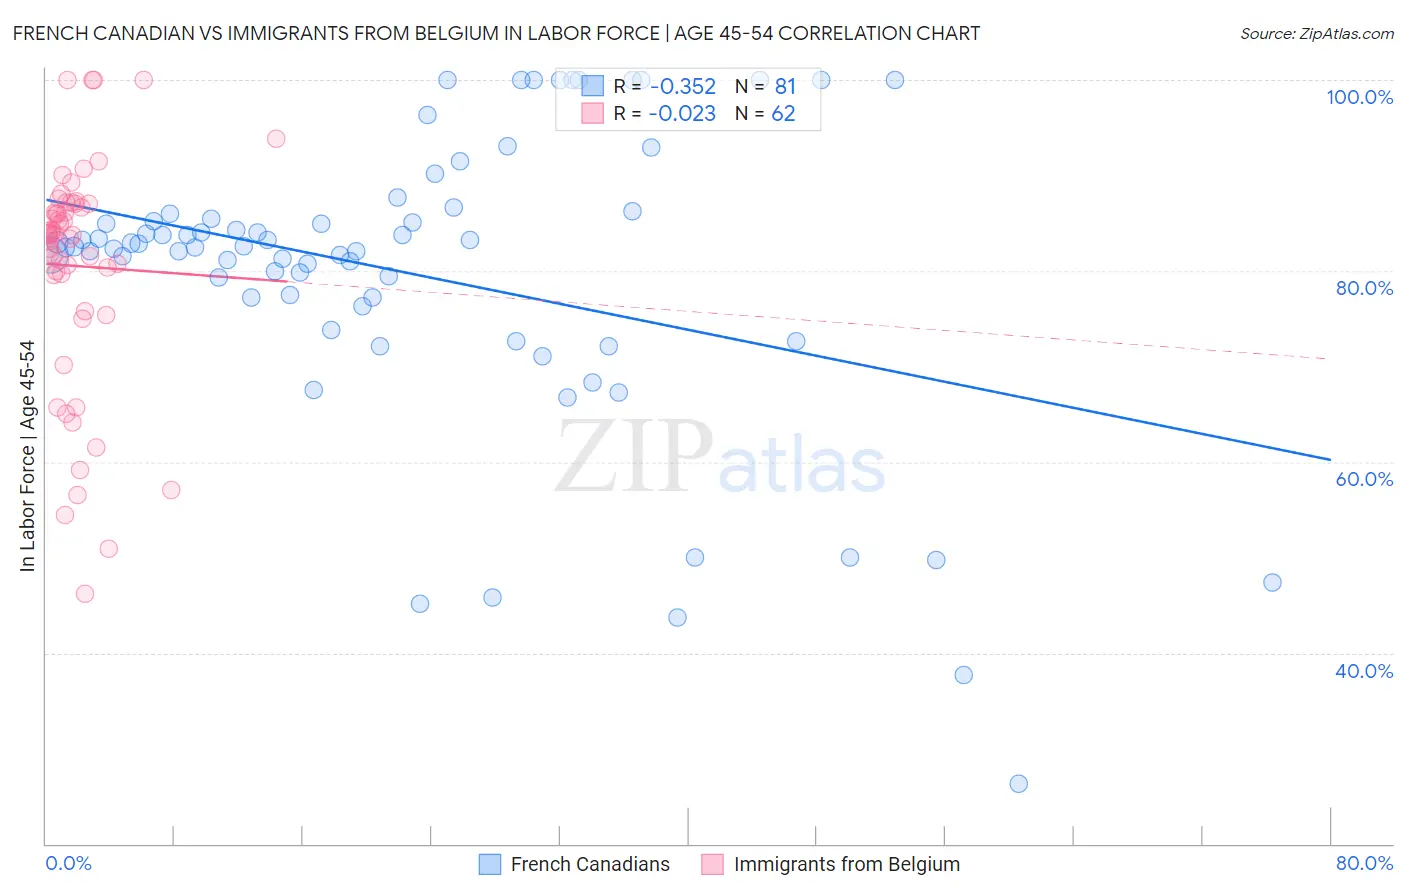
French Canadian vs Immigrants from Belgium In Labor Force | Age 45-54 Correlation Chart

The statistical analysis conducted on geographies consisting of 502,209,995 people shows a mild negative correlation between the proportion of French Canadians and labor force participation rate among population between the ages 45 and 54 in the United States with a correlation coefficient (R) of -0.352 and weighted average of 82.5%. Similarly, the statistical analysis conducted on geographies consisting of 146,695,450 people shows no correlation between the proportion of Immigrants from Belgium and labor force participation rate among population between the ages 45 and 54 in the United States with a correlation coefficient (R) of -0.023 and weighted average of 83.1%, a difference of 0.78%.
French Canadian vs Immigrants from Belgium In Labor Force | Age 45-54

In Labor Force | Age 45-54 Correlation Summary

MeasurementFrench CanadianImmigrants from Belgium
Minimum26.3%46.2%
Maximum100.0%100.0%
Range73.7%53.8%
Mean79.7%80.5%
Median82.6%83.9%
Interquartile 25% (IQ1)76.8%79.6%
Interquartile 75% (IQ3)85.7%87.0%
Interquartile Range (IQR)8.9%7.4%
Standard Deviation (Sample)15.4%11.9%
Standard Deviation (Population)15.3%11.8%

Similar Demographics by In Labor Force | Age 45-54

Demographics Similar to French Canadians by In Labor Force | Age 45-54

In terms of in labor force | age 45-54, the demographic groups most similar to French Canadians are Moroccan (82.5%, a difference of 0.0%), Canadian (82.4%, a difference of 0.010%), Immigrants from Western Asia (82.4%, a difference of 0.010%), Immigrants from Denmark (82.5%, a difference of 0.040%), and Immigrants from North America (82.5%, a difference of 0.050%).
DemographicsRating | RankIn Labor Force | Age 45-54
Australians
20.8
/100
|
#193
Fair
82.5%
Immigrants | Norway
20.7
/100
|
#194
Fair
82.5%
Immigrants | Canada
20.0
/100
|
#195
Fair
82.5%
Immigrants | North America
18.8
/100
|
#196
Poor
82.5%
Lebanese
18.2
/100
|
#197
Poor
82.5%
Immigrants | Denmark
17.9
/100
|
#198
Poor
82.5%
Moroccans
15.7
/100
|
#199
Poor
82.5%
French Canadians
15.4
/100
|
#200
Poor
82.5%
Canadians
15.1
/100
|
#201
Poor
82.4%
Immigrants | Western Asia
14.9
/100
|
#202
Poor
82.4%
Arabs
11.6
/100
|
#203
Poor
82.4%
Immigrants | Western Europe
10.9
/100
|
#204
Poor
82.4%
Senegalese
9.5
/100
|
#205
Tragic
82.4%
Welsh
9.2
/100
|
#206
Tragic
82.3%
Immigrants | Cabo Verde
8.6
/100
|
#207
Tragic
82.3%

Demographics Similar to Immigrants from Belgium by In Labor Force | Age 45-54

In terms of in labor force | age 45-54, the demographic groups most similar to Immigrants from Belgium are Immigrants from Iran (83.1%, a difference of 0.020%), Immigrants from Jordan (83.1%, a difference of 0.020%), German (83.1%, a difference of 0.020%), Immigrants from Northern Europe (83.1%, a difference of 0.020%), and Bermudan (83.1%, a difference of 0.030%).
DemographicsRating | RankIn Labor Force | Age 45-54
Immigrants | Uruguay
90.2
/100
|
#119
Exceptional
83.2%
Immigrants | Russia
90.1
/100
|
#120
Exceptional
83.2%
Uruguayans
89.4
/100
|
#121
Excellent
83.1%
Immigrants | Vietnam
88.9
/100
|
#122
Excellent
83.1%
Tongans
88.2
/100
|
#123
Excellent
83.1%
Bermudans
88.0
/100
|
#124
Excellent
83.1%
Immigrants | Iran
87.2
/100
|
#125
Excellent
83.1%
Immigrants | Belgium
86.4
/100
|
#126
Excellent
83.1%
Immigrants | Jordan
85.2
/100
|
#127
Excellent
83.1%
Germans
85.1
/100
|
#128
Excellent
83.1%
Immigrants | Northern Europe
85.1
/100
|
#129
Excellent
83.1%
Immigrants | Israel
84.7
/100
|
#130
Excellent
83.1%
Finns
83.3
/100
|
#131
Excellent
83.1%
Immigrants | Ukraine
82.9
/100
|
#132
Excellent
83.0%
Liberians
82.7
/100
|
#133
Excellent
83.0%