Chilean vs Immigrants from Belgium In Labor Force | Age 45-54
COMPARE
Chilean
Immigrants from Belgium
In Labor Force | Age 45-54
In Labor Force | Age 45-54 Comparison
Chileans
Immigrants from Belgium
83.4%
IN LABOR FORCE | AGE 45-54
97.7/ 100
METRIC RATING
67th/ 347
METRIC RANK
83.1%
IN LABOR FORCE | AGE 45-54
86.4/ 100
METRIC RATING
126th/ 347
METRIC RANK
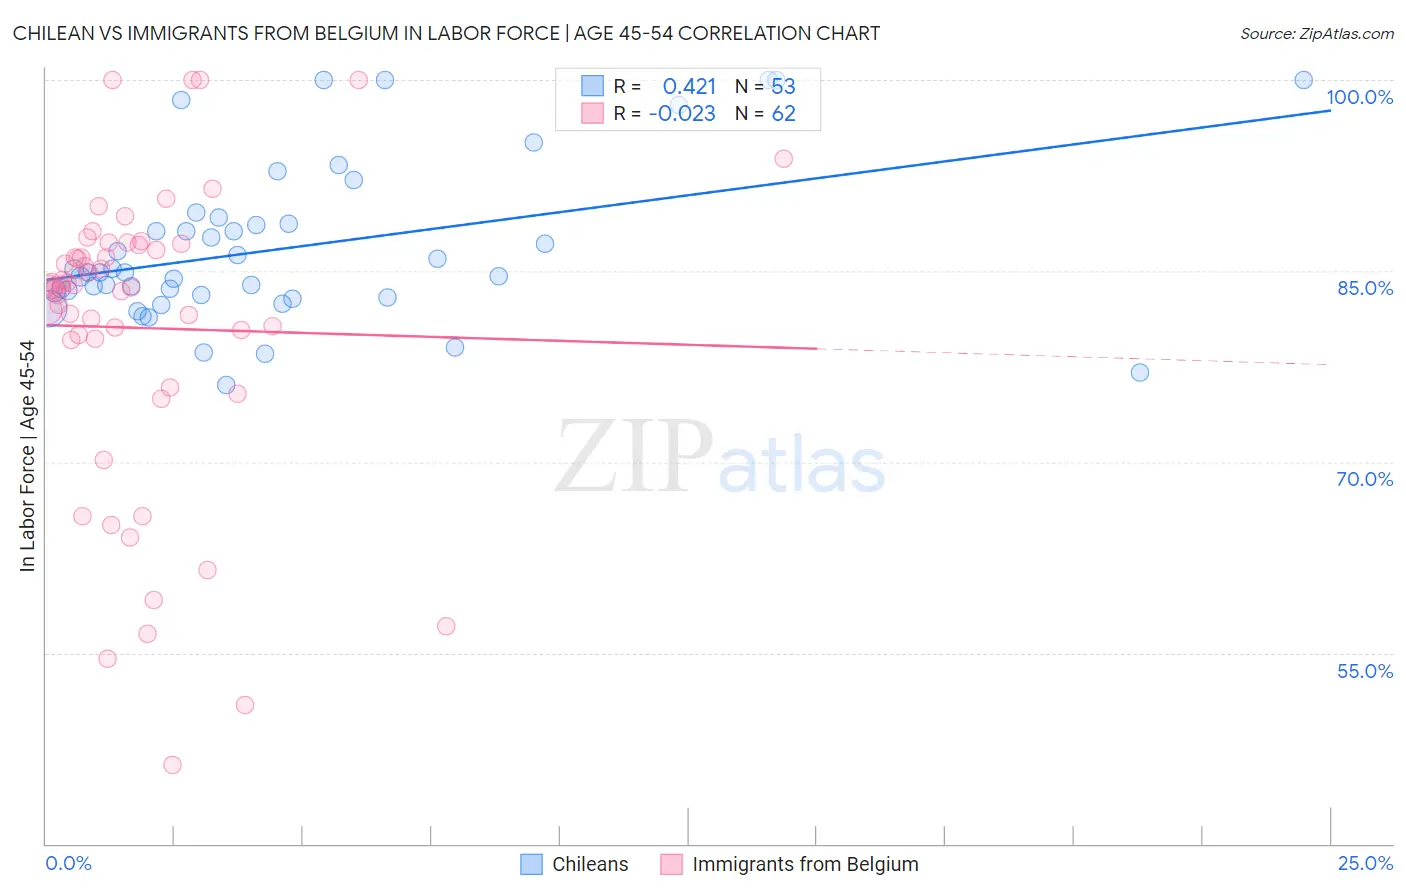
Chilean vs Immigrants from Belgium In Labor Force | Age 45-54 Correlation Chart
The statistical analysis conducted on geographies consisting of 256,549,165 people shows a moderate positive correlation between the proportion of Chileans and labor force participation rate among population between the ages 45 and 54 in the United States with a correlation coefficient (R) of 0.421 and weighted average of 83.4%. Similarly, the statistical analysis conducted on geographies consisting of 146,695,450 people shows no correlation between the proportion of Immigrants from Belgium and labor force participation rate among population between the ages 45 and 54 in the United States with a correlation coefficient (R) of -0.023 and weighted average of 83.1%, a difference of 0.42%.
In Labor Force | Age 45-54 Correlation Summary
| Measurement | Chilean | Immigrants from Belgium |
| Minimum | 76.0% | 46.2% |
| Maximum | 100.0% | 100.0% |
| Range | 24.0% | 53.8% |
| Mean | 86.8% | 80.5% |
| Median | 84.9% | 83.9% |
| Interquartile 25% (IQ1) | 83.0% | 79.6% |
| Interquartile 75% (IQ3) | 88.9% | 87.0% |
| Interquartile Range (IQR) | 5.9% | 7.4% |
| Standard Deviation (Sample) | 6.3% | 11.9% |
| Standard Deviation (Population) | 6.2% | 11.8% |
Similar Demographics by In Labor Force | Age 45-54
Demographics Similar to Chileans by In Labor Force | Age 45-54
In terms of in labor force | age 45-54, the demographic groups most similar to Chileans are Asian (83.4%, a difference of 0.0%), Egyptian (83.5%, a difference of 0.010%), Immigrants from Colombia (83.4%, a difference of 0.010%), Afghan (83.5%, a difference of 0.020%), and Immigrants from Kenya (83.5%, a difference of 0.020%).
| Demographics | Rating | Rank | In Labor Force | Age 45-54 |
| Carpatho Rusyns | 98.3 /100 | #60 | Exceptional 83.5% |
| Filipinos | 98.3 /100 | #61 | Exceptional 83.5% |
| Immigrants | Taiwan | 98.0 /100 | #62 | Exceptional 83.5% |
| Afghans | 97.9 /100 | #63 | Exceptional 83.5% |
| Immigrants | Kenya | 97.9 /100 | #64 | Exceptional 83.5% |
| Egyptians | 97.9 /100 | #65 | Exceptional 83.5% |
| Asians | 97.7 /100 | #66 | Exceptional 83.4% |
| Chileans | 97.7 /100 | #67 | Exceptional 83.4% |
| Immigrants | Colombia | 97.6 /100 | #68 | Exceptional 83.4% |
| Taiwanese | 97.5 /100 | #69 | Exceptional 83.4% |
| Immigrants | Latvia | 97.4 /100 | #70 | Exceptional 83.4% |
| Colombians | 97.3 /100 | #71 | Exceptional 83.4% |
| Serbians | 97.2 /100 | #72 | Exceptional 83.4% |
| Immigrants | Czechoslovakia | 97.1 /100 | #73 | Exceptional 83.4% |
| Immigrants | Somalia | 96.9 /100 | #74 | Exceptional 83.4% |
Demographics Similar to Immigrants from Belgium by In Labor Force | Age 45-54
In terms of in labor force | age 45-54, the demographic groups most similar to Immigrants from Belgium are Immigrants from Iran (83.1%, a difference of 0.020%), Immigrants from Jordan (83.1%, a difference of 0.020%), German (83.1%, a difference of 0.020%), Immigrants from Northern Europe (83.1%, a difference of 0.020%), and Bermudan (83.1%, a difference of 0.030%).
| Demographics | Rating | Rank | In Labor Force | Age 45-54 |
| Immigrants | Uruguay | 90.2 /100 | #119 | Exceptional 83.2% |
| Immigrants | Russia | 90.1 /100 | #120 | Exceptional 83.2% |
| Uruguayans | 89.4 /100 | #121 | Excellent 83.1% |
| Immigrants | Vietnam | 88.9 /100 | #122 | Excellent 83.1% |
| Tongans | 88.2 /100 | #123 | Excellent 83.1% |
| Bermudans | 88.0 /100 | #124 | Excellent 83.1% |
| Immigrants | Iran | 87.2 /100 | #125 | Excellent 83.1% |
| Immigrants | Belgium | 86.4 /100 | #126 | Excellent 83.1% |
| Immigrants | Jordan | 85.2 /100 | #127 | Excellent 83.1% |
| Germans | 85.1 /100 | #128 | Excellent 83.1% |
| Immigrants | Northern Europe | 85.1 /100 | #129 | Excellent 83.1% |
| Immigrants | Israel | 84.7 /100 | #130 | Excellent 83.1% |
| Finns | 83.3 /100 | #131 | Excellent 83.1% |
| Immigrants | Ukraine | 82.9 /100 | #132 | Excellent 83.0% |
| Liberians | 82.7 /100 | #133 | Excellent 83.0% |