Aleut vs Immigrants from Belgium Unemployment Among Seniors over 75 years
COMPARE
Aleut
Immigrants from Belgium
Unemployment Among Seniors over 75 years
Unemployment Among Seniors over 75 years Comparison
Aleuts
Immigrants from Belgium
10.3%
UNEMPLOYMENT AMONG SENIORS OVER 75 YEARS
0.0/ 100
METRIC RATING
321st/ 347
METRIC RANK
8.2%
UNEMPLOYMENT AMONG SENIORS OVER 75 YEARS
99.3/ 100
METRIC RATING
96th/ 347
METRIC RANK
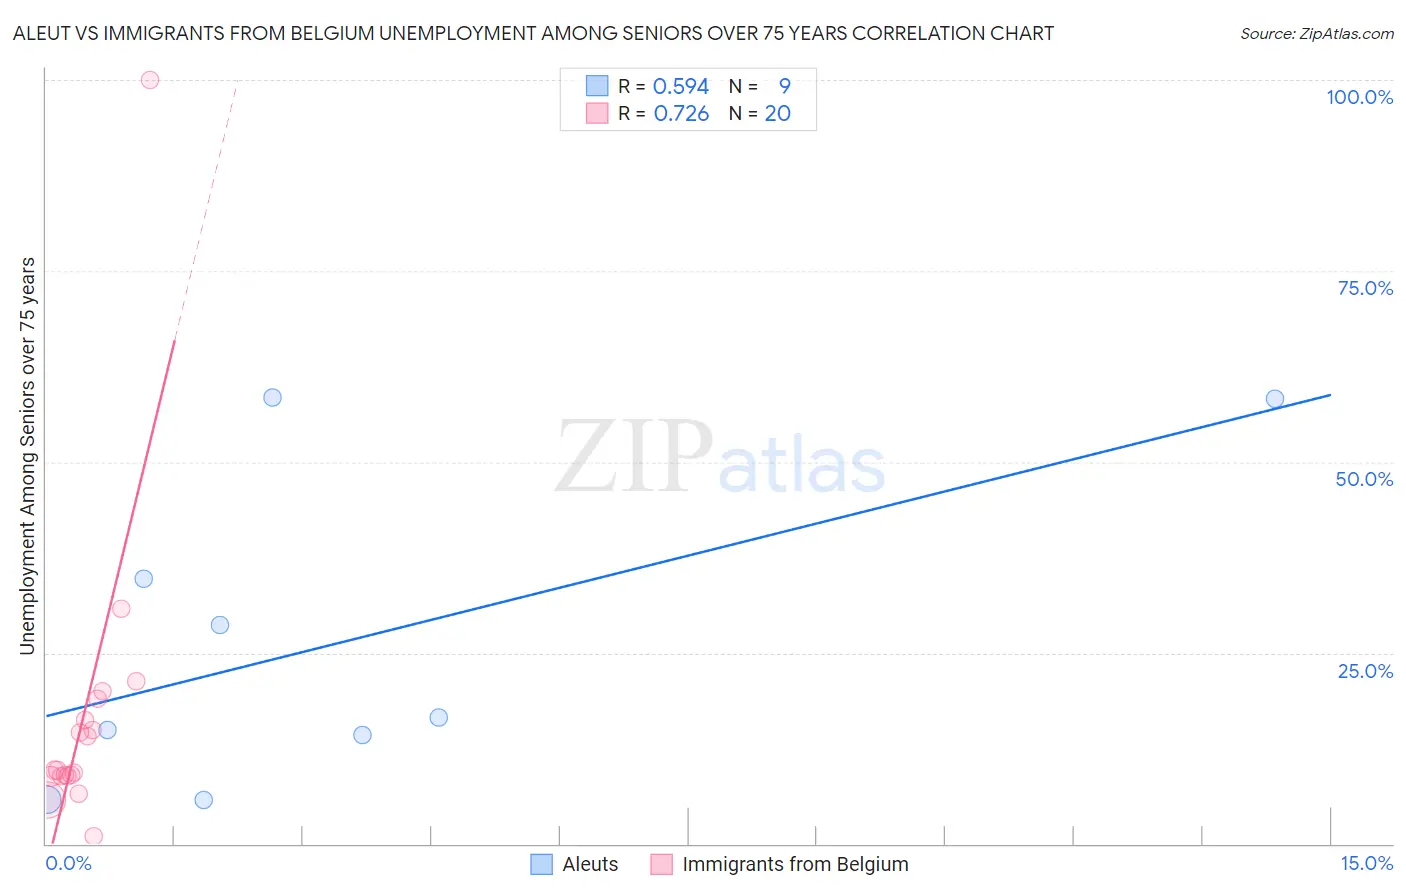
Aleut vs Immigrants from Belgium Unemployment Among Seniors over 75 years Correlation Chart
The statistical analysis conducted on geographies consisting of 49,450,767 people shows a substantial positive correlation between the proportion of Aleuts and unemployment rate among seniors over the age of 75 in the United States with a correlation coefficient (R) of 0.594 and weighted average of 10.3%. Similarly, the statistical analysis conducted on geographies consisting of 103,995,962 people shows a strong positive correlation between the proportion of Immigrants from Belgium and unemployment rate among seniors over the age of 75 in the United States with a correlation coefficient (R) of 0.726 and weighted average of 8.2%, a difference of 26.0%.
Unemployment Among Seniors over 75 years Correlation Summary
| Measurement | Aleut | Immigrants from Belgium |
| Minimum | 5.8% | 1.0% |
| Maximum | 58.4% | 100.0% |
| Range | 52.6% | 99.0% |
| Mean | 26.4% | 16.8% |
| Median | 16.5% | 9.6% |
| Interquartile 25% (IQ1) | 10.0% | 8.9% |
| Interquartile 75% (IQ3) | 46.5% | 17.5% |
| Interquartile Range (IQR) | 36.4% | 8.7% |
| Standard Deviation (Sample) | 20.4% | 20.7% |
| Standard Deviation (Population) | 19.3% | 20.1% |
Similar Demographics by Unemployment Among Seniors over 75 years
Demographics Similar to Aleuts by Unemployment Among Seniors over 75 years
In terms of unemployment among seniors over 75 years, the demographic groups most similar to Aleuts are French (10.3%, a difference of 0.010%), German (10.3%, a difference of 0.23%), Liberian (10.2%, a difference of 0.31%), Polish (10.3%, a difference of 0.35%), and Irish (10.2%, a difference of 0.43%).
| Demographics | Rating | Rank | Unemployment Among Seniors over 75 years |
| Dutch West Indians | 0.0 /100 | #314 | Tragic 10.2% |
| Pennsylvania Germans | 0.0 /100 | #315 | Tragic 10.2% |
| Natives/Alaskans | 0.0 /100 | #316 | Tragic 10.2% |
| Irish | 0.0 /100 | #317 | Tragic 10.2% |
| Liberians | 0.0 /100 | #318 | Tragic 10.2% |
| Germans | 0.0 /100 | #319 | Tragic 10.3% |
| French | 0.0 /100 | #320 | Tragic 10.3% |
| Aleuts | 0.0 /100 | #321 | Tragic 10.3% |
| Poles | 0.0 /100 | #322 | Tragic 10.3% |
| Tongans | 0.0 /100 | #323 | Tragic 10.4% |
| Americans | 0.0 /100 | #324 | Tragic 10.4% |
| Portuguese | 0.0 /100 | #325 | Tragic 10.4% |
| Slovaks | 0.0 /100 | #326 | Tragic 10.4% |
| Dutch | 0.0 /100 | #327 | Tragic 10.4% |
| Immigrants | Portugal | 0.0 /100 | #328 | Tragic 10.5% |
Demographics Similar to Immigrants from Belgium by Unemployment Among Seniors over 75 years
In terms of unemployment among seniors over 75 years, the demographic groups most similar to Immigrants from Belgium are Nicaraguan (8.2%, a difference of 0.020%), Immigrants from Sri Lanka (8.2%, a difference of 0.080%), Immigrants from Northern Africa (8.2%, a difference of 0.12%), Burmese (8.2%, a difference of 0.21%), and Immigrants from Kazakhstan (8.2%, a difference of 0.22%).
| Demographics | Rating | Rank | Unemployment Among Seniors over 75 years |
| Immigrants | Korea | 99.5 /100 | #89 | Exceptional 8.1% |
| Immigrants | Vietnam | 99.5 /100 | #90 | Exceptional 8.1% |
| Egyptians | 99.5 /100 | #91 | Exceptional 8.1% |
| Venezuelans | 99.5 /100 | #92 | Exceptional 8.1% |
| Immigrants | Netherlands | 99.5 /100 | #93 | Exceptional 8.1% |
| Immigrants | Ireland | 99.4 /100 | #94 | Exceptional 8.1% |
| Nicaraguans | 99.3 /100 | #95 | Exceptional 8.2% |
| Immigrants | Belgium | 99.3 /100 | #96 | Exceptional 8.2% |
| Immigrants | Sri Lanka | 99.3 /100 | #97 | Exceptional 8.2% |
| Immigrants | Northern Africa | 99.3 /100 | #98 | Exceptional 8.2% |
| Burmese | 99.2 /100 | #99 | Exceptional 8.2% |
| Immigrants | Kazakhstan | 99.2 /100 | #100 | Exceptional 8.2% |
| Immigrants | Serbia | 99.2 /100 | #101 | Exceptional 8.2% |
| Immigrants | Panama | 99.1 /100 | #102 | Exceptional 8.2% |
| South American Indians | 99.1 /100 | #103 | Exceptional 8.2% |