Immigrants from the Azores vs Immigrants from Belgium In Labor Force | Age 45-54
COMPARE
Immigrants from the Azores
Immigrants from Belgium
In Labor Force | Age 45-54
In Labor Force | Age 45-54 Comparison
Immigrants from the Azores
Immigrants from Belgium
80.1%
IN LABOR FORCE | AGE 45-54
0.0/ 100
METRIC RATING
303rd/ 347
METRIC RANK
83.1%
IN LABOR FORCE | AGE 45-54
86.4/ 100
METRIC RATING
126th/ 347
METRIC RANK
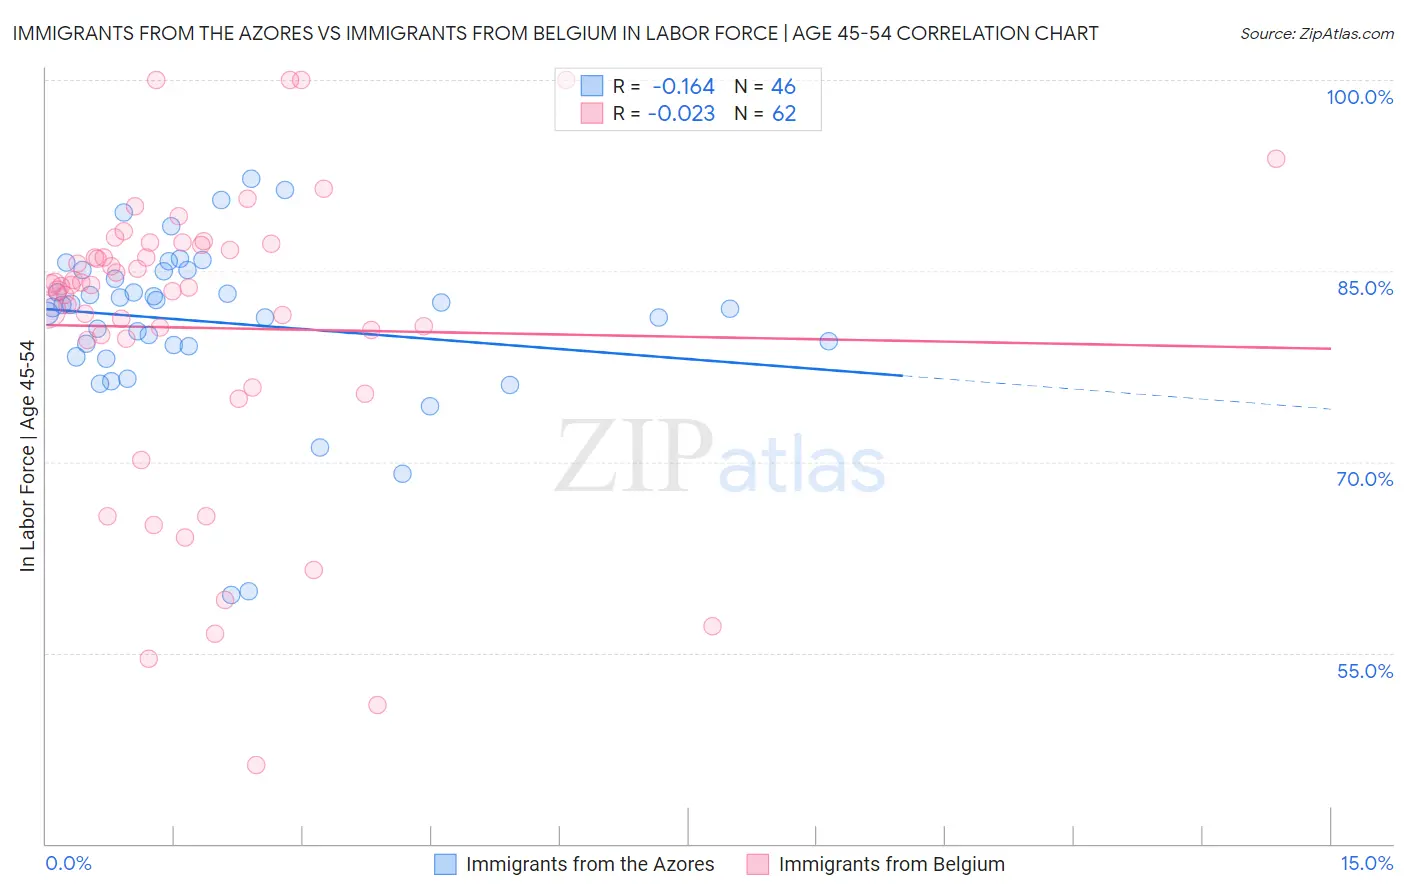
Immigrants from the Azores vs Immigrants from Belgium In Labor Force | Age 45-54 Correlation Chart
The statistical analysis conducted on geographies consisting of 46,256,380 people shows a poor negative correlation between the proportion of Immigrants from the Azores and labor force participation rate among population between the ages 45 and 54 in the United States with a correlation coefficient (R) of -0.164 and weighted average of 80.1%. Similarly, the statistical analysis conducted on geographies consisting of 146,695,450 people shows no correlation between the proportion of Immigrants from Belgium and labor force participation rate among population between the ages 45 and 54 in the United States with a correlation coefficient (R) of -0.023 and weighted average of 83.1%, a difference of 3.7%.
In Labor Force | Age 45-54 Correlation Summary
| Measurement | Immigrants from the Azores | Immigrants from Belgium |
| Minimum | 59.5% | 46.2% |
| Maximum | 92.2% | 100.0% |
| Range | 32.7% | 53.8% |
| Mean | 81.0% | 80.5% |
| Median | 82.2% | 83.9% |
| Interquartile 25% (IQ1) | 79.1% | 79.6% |
| Interquartile 75% (IQ3) | 85.0% | 87.0% |
| Interquartile Range (IQR) | 5.9% | 7.4% |
| Standard Deviation (Sample) | 6.6% | 11.9% |
| Standard Deviation (Population) | 6.5% | 11.8% |
Similar Demographics by In Labor Force | Age 45-54
Demographics Similar to Immigrants from the Azores by In Labor Force | Age 45-54
In terms of in labor force | age 45-54, the demographic groups most similar to Immigrants from the Azores are Hispanic or Latino (80.1%, a difference of 0.020%), Immigrants from Dominican Republic (80.1%, a difference of 0.030%), Immigrants from Central America (80.2%, a difference of 0.070%), Spanish American (80.1%, a difference of 0.070%), and Spanish American Indian (80.2%, a difference of 0.14%).
| Demographics | Rating | Rank | In Labor Force | Age 45-54 |
| Africans | 0.0 /100 | #296 | Tragic 80.5% |
| Americans | 0.0 /100 | #297 | Tragic 80.4% |
| Marshallese | 0.0 /100 | #298 | Tragic 80.3% |
| Dominicans | 0.0 /100 | #299 | Tragic 80.3% |
| Fijians | 0.0 /100 | #300 | Tragic 80.2% |
| Spanish American Indians | 0.0 /100 | #301 | Tragic 80.2% |
| Immigrants | Central America | 0.0 /100 | #302 | Tragic 80.2% |
| Immigrants | Azores | 0.0 /100 | #303 | Tragic 80.1% |
| Hispanics or Latinos | 0.0 /100 | #304 | Tragic 80.1% |
| Immigrants | Dominican Republic | 0.0 /100 | #305 | Tragic 80.1% |
| Spanish Americans | 0.0 /100 | #306 | Tragic 80.1% |
| Blackfeet | 0.0 /100 | #307 | Tragic 80.0% |
| Central American Indians | 0.0 /100 | #308 | Tragic 80.0% |
| Potawatomi | 0.0 /100 | #309 | Tragic 80.0% |
| Inupiat | 0.0 /100 | #310 | Tragic 79.9% |
Demographics Similar to Immigrants from Belgium by In Labor Force | Age 45-54
In terms of in labor force | age 45-54, the demographic groups most similar to Immigrants from Belgium are Immigrants from Iran (83.1%, a difference of 0.020%), Immigrants from Jordan (83.1%, a difference of 0.020%), German (83.1%, a difference of 0.020%), Immigrants from Northern Europe (83.1%, a difference of 0.020%), and Bermudan (83.1%, a difference of 0.030%).
| Demographics | Rating | Rank | In Labor Force | Age 45-54 |
| Immigrants | Uruguay | 90.2 /100 | #119 | Exceptional 83.2% |
| Immigrants | Russia | 90.1 /100 | #120 | Exceptional 83.2% |
| Uruguayans | 89.4 /100 | #121 | Excellent 83.1% |
| Immigrants | Vietnam | 88.9 /100 | #122 | Excellent 83.1% |
| Tongans | 88.2 /100 | #123 | Excellent 83.1% |
| Bermudans | 88.0 /100 | #124 | Excellent 83.1% |
| Immigrants | Iran | 87.2 /100 | #125 | Excellent 83.1% |
| Immigrants | Belgium | 86.4 /100 | #126 | Excellent 83.1% |
| Immigrants | Jordan | 85.2 /100 | #127 | Excellent 83.1% |
| Germans | 85.1 /100 | #128 | Excellent 83.1% |
| Immigrants | Northern Europe | 85.1 /100 | #129 | Excellent 83.1% |
| Immigrants | Israel | 84.7 /100 | #130 | Excellent 83.1% |
| Finns | 83.3 /100 | #131 | Excellent 83.1% |
| Immigrants | Ukraine | 82.9 /100 | #132 | Excellent 83.0% |
| Liberians | 82.7 /100 | #133 | Excellent 83.0% |