Aleut vs Immigrants from Belgium Ambulatory Disability
COMPARE
Aleut
Immigrants from Belgium
Ambulatory Disability
Ambulatory Disability Comparison
Aleuts
Immigrants from Belgium
6.6%
AMBULATORY DISABILITY
0.4/ 100
METRIC RATING
259th/ 347
METRIC RANK
5.6%
AMBULATORY DISABILITY
99.7/ 100
METRIC RATING
61st/ 347
METRIC RANK
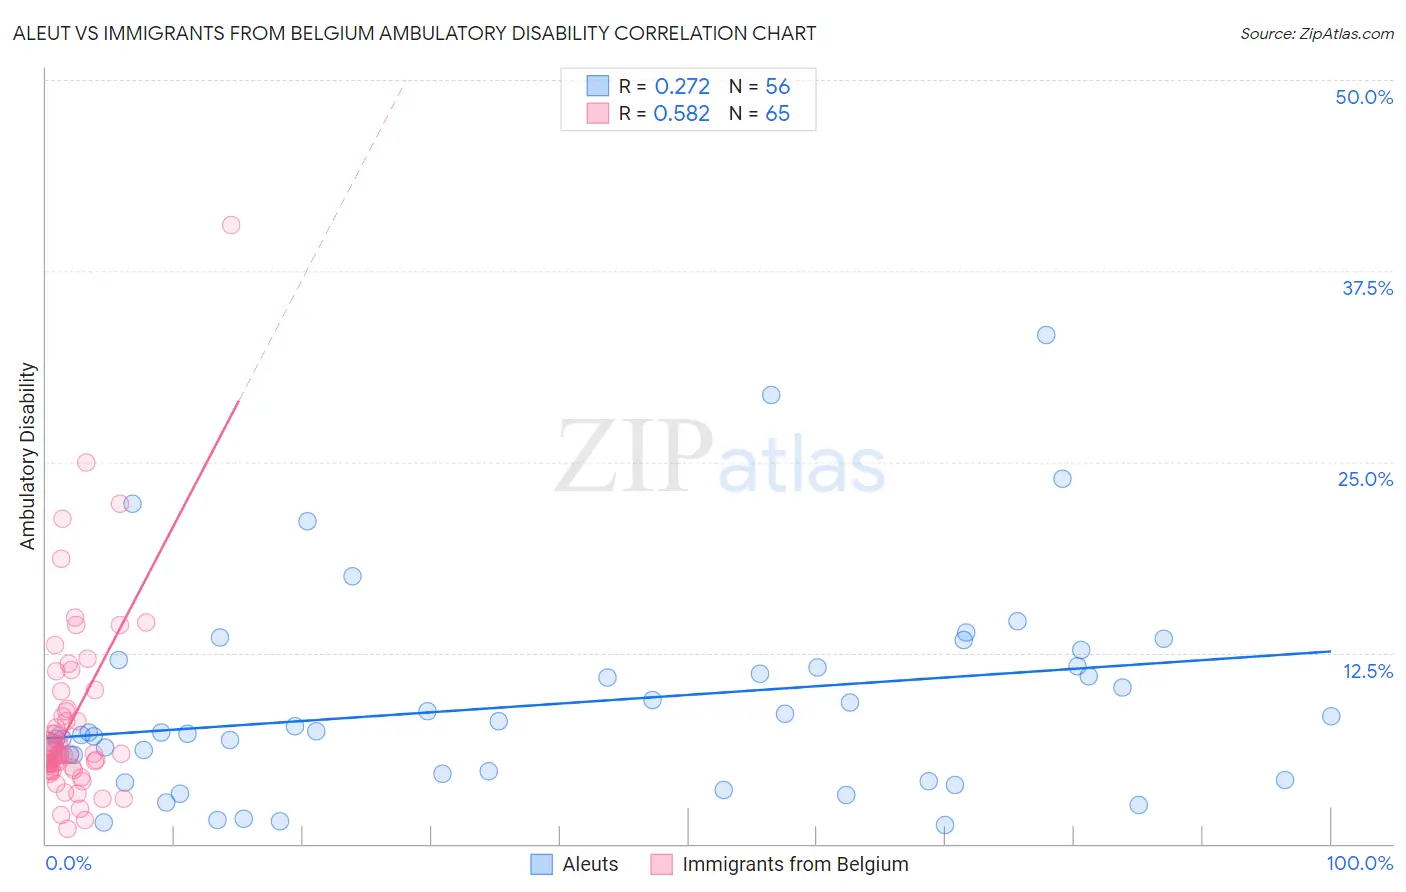
Aleut vs Immigrants from Belgium Ambulatory Disability Correlation Chart
The statistical analysis conducted on geographies consisting of 61,775,810 people shows a weak positive correlation between the proportion of Aleuts and percentage of population with ambulatory disability in the United States with a correlation coefficient (R) of 0.272 and weighted average of 6.6%. Similarly, the statistical analysis conducted on geographies consisting of 146,707,151 people shows a substantial positive correlation between the proportion of Immigrants from Belgium and percentage of population with ambulatory disability in the United States with a correlation coefficient (R) of 0.582 and weighted average of 5.6%, a difference of 16.3%.
Ambulatory Disability Correlation Summary
| Measurement | Aleut | Immigrants from Belgium |
| Minimum | 1.2% | 0.96% |
| Maximum | 33.3% | 40.5% |
| Range | 32.1% | 39.5% |
| Mean | 9.1% | 8.1% |
| Median | 7.3% | 5.9% |
| Interquartile 25% (IQ1) | 4.4% | 4.9% |
| Interquartile 75% (IQ3) | 11.6% | 9.4% |
| Interquartile Range (IQR) | 7.2% | 4.5% |
| Standard Deviation (Sample) | 6.7% | 6.3% |
| Standard Deviation (Population) | 6.6% | 6.3% |
Similar Demographics by Ambulatory Disability
Demographics Similar to Aleuts by Ambulatory Disability
In terms of ambulatory disability, the demographic groups most similar to Aleuts are Immigrants from Belize (6.6%, a difference of 0.010%), Irish (6.6%, a difference of 0.080%), Spanish American Indian (6.5%, a difference of 0.18%), English (6.6%, a difference of 0.25%), and Bermudan (6.5%, a difference of 0.26%).
| Demographics | Rating | Rank | Ambulatory Disability |
| Immigrants | Bahamas | 0.8 /100 | #252 | Tragic 6.5% |
| Scottish | 0.7 /100 | #253 | Tragic 6.5% |
| Belizeans | 0.7 /100 | #254 | Tragic 6.5% |
| Welsh | 0.6 /100 | #255 | Tragic 6.5% |
| Immigrants | Uzbekistan | 0.6 /100 | #256 | Tragic 6.5% |
| Bermudans | 0.5 /100 | #257 | Tragic 6.5% |
| Spanish American Indians | 0.5 /100 | #258 | Tragic 6.5% |
| Aleuts | 0.4 /100 | #259 | Tragic 6.6% |
| Immigrants | Belize | 0.4 /100 | #260 | Tragic 6.6% |
| Irish | 0.4 /100 | #261 | Tragic 6.6% |
| English | 0.4 /100 | #262 | Tragic 6.6% |
| Hmong | 0.3 /100 | #263 | Tragic 6.6% |
| Nepalese | 0.2 /100 | #264 | Tragic 6.6% |
| Bahamians | 0.2 /100 | #265 | Tragic 6.6% |
| Guyanese | 0.2 /100 | #266 | Tragic 6.6% |
Demographics Similar to Immigrants from Belgium by Ambulatory Disability
In terms of ambulatory disability, the demographic groups most similar to Immigrants from Belgium are Immigrants from Spain (5.6%, a difference of 0.010%), Immigrants from Lithuania (5.6%, a difference of 0.12%), Immigrants from France (5.6%, a difference of 0.13%), Immigrants from Afghanistan (5.6%, a difference of 0.16%), and Immigrants from Zimbabwe (5.6%, a difference of 0.20%).
| Demographics | Rating | Rank | Ambulatory Disability |
| Immigrants | Eastern Africa | 99.8 /100 | #54 | Exceptional 5.6% |
| Immigrants | Bulgaria | 99.8 /100 | #55 | Exceptional 5.6% |
| Inupiat | 99.8 /100 | #56 | Exceptional 5.6% |
| Immigrants | Brazil | 99.8 /100 | #57 | Exceptional 5.6% |
| Immigrants | Zimbabwe | 99.8 /100 | #58 | Exceptional 5.6% |
| Immigrants | Afghanistan | 99.8 /100 | #59 | Exceptional 5.6% |
| Immigrants | Lithuania | 99.8 /100 | #60 | Exceptional 5.6% |
| Immigrants | Belgium | 99.7 /100 | #61 | Exceptional 5.6% |
| Immigrants | Spain | 99.7 /100 | #62 | Exceptional 5.6% |
| Immigrants | France | 99.7 /100 | #63 | Exceptional 5.6% |
| Laotians | 99.7 /100 | #64 | Exceptional 5.7% |
| Immigrants | Switzerland | 99.7 /100 | #65 | Exceptional 5.7% |
| Israelis | 99.6 /100 | #66 | Exceptional 5.7% |
| Immigrants | Uganda | 99.6 /100 | #67 | Exceptional 5.7% |
| Sri Lankans | 99.6 /100 | #68 | Exceptional 5.7% |