Aleut vs Norwegian In Labor Force | Age 45-54
COMPARE
Aleut
Norwegian
In Labor Force | Age 45-54
In Labor Force | Age 45-54 Comparison
Aleuts
Norwegians
81.0%
IN LABOR FORCE | AGE 45-54
0.0/ 100
METRIC RATING
282nd/ 347
METRIC RANK
84.4%
IN LABOR FORCE | AGE 45-54
100.0/ 100
METRIC RATING
10th/ 347
METRIC RANK
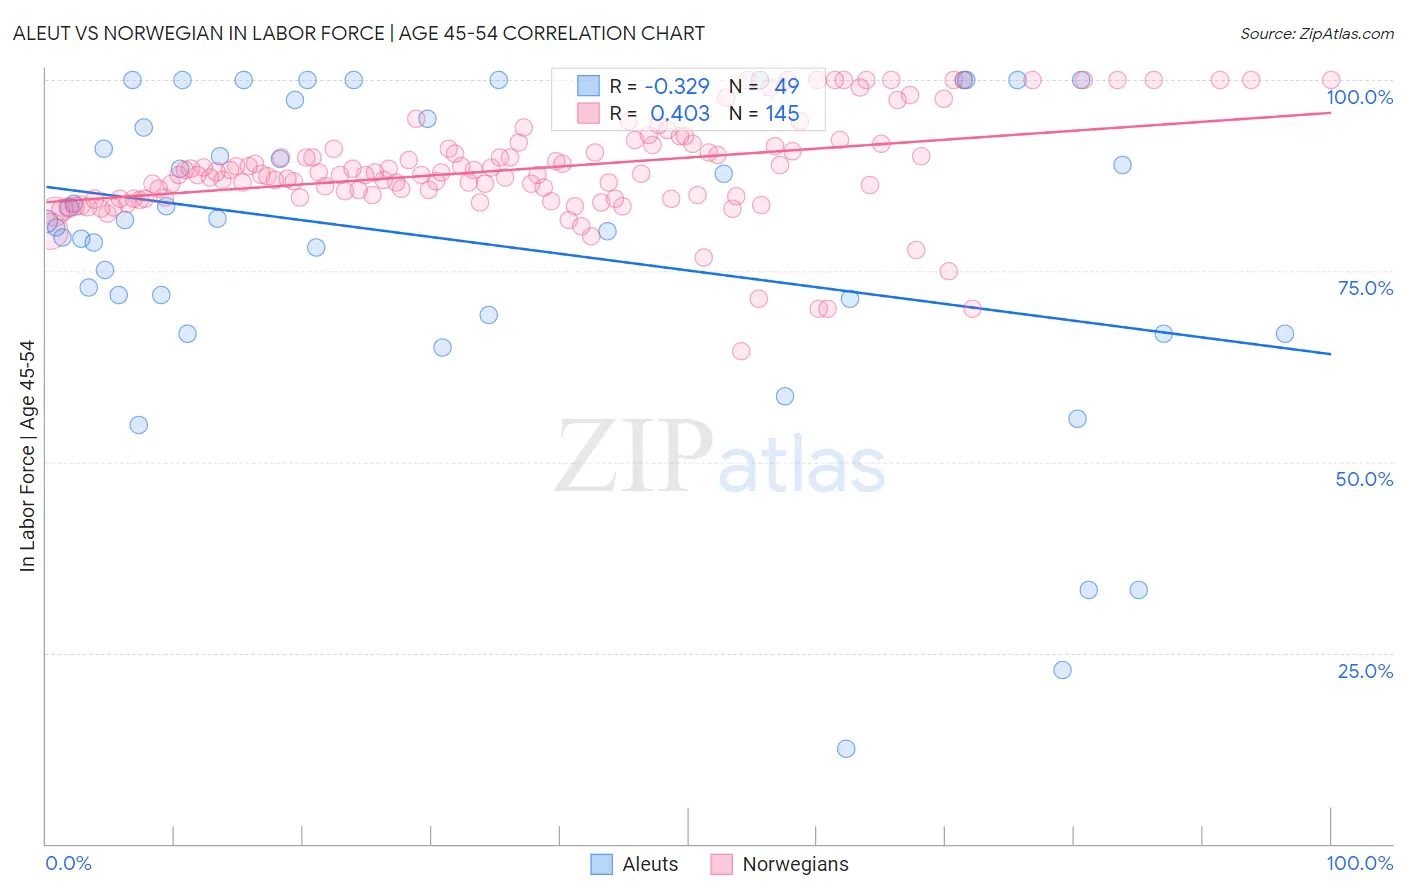
Aleut vs Norwegian In Labor Force | Age 45-54 Correlation Chart
The statistical analysis conducted on geographies consisting of 61,774,977 people shows a mild negative correlation between the proportion of Aleuts and labor force participation rate among population between the ages 45 and 54 in the United States with a correlation coefficient (R) of -0.329 and weighted average of 81.0%. Similarly, the statistical analysis conducted on geographies consisting of 532,809,238 people shows a moderate positive correlation between the proportion of Norwegians and labor force participation rate among population between the ages 45 and 54 in the United States with a correlation coefficient (R) of 0.403 and weighted average of 84.4%, a difference of 4.3%.
In Labor Force | Age 45-54 Correlation Summary
| Measurement | Aleut | Norwegian |
| Minimum | 12.5% | 64.5% |
| Maximum | 100.0% | 100.0% |
| Range | 87.5% | 35.5% |
| Mean | 78.8% | 88.4% |
| Median | 81.6% | 87.6% |
| Interquartile 25% (IQ1) | 70.3% | 84.6% |
| Interquartile 75% (IQ3) | 96.2% | 91.6% |
| Interquartile Range (IQR) | 25.9% | 7.0% |
| Standard Deviation (Sample) | 20.7% | 6.7% |
| Standard Deviation (Population) | 20.5% | 6.6% |
Similar Demographics by In Labor Force | Age 45-54
Demographics Similar to Aleuts by In Labor Force | Age 45-54
In terms of in labor force | age 45-54, the demographic groups most similar to Aleuts are Immigrants from Latin America (81.0%, a difference of 0.070%), Immigrants from Grenada (81.0%, a difference of 0.070%), French American Indian (80.8%, a difference of 0.17%), Immigrants from Micronesia (81.1%, a difference of 0.18%), and Immigrants from Guatemala (81.1%, a difference of 0.19%).
| Demographics | Rating | Rank | In Labor Force | Age 45-54 |
| Immigrants | Nonimmigrants | 0.0 /100 | #275 | Tragic 81.2% |
| U.S. Virgin Islanders | 0.0 /100 | #276 | Tragic 81.2% |
| Guatemalans | 0.0 /100 | #277 | Tragic 81.2% |
| Immigrants | Guatemala | 0.0 /100 | #278 | Tragic 81.1% |
| Immigrants | Micronesia | 0.0 /100 | #279 | Tragic 81.1% |
| Immigrants | Latin America | 0.0 /100 | #280 | Tragic 81.0% |
| Immigrants | Grenada | 0.0 /100 | #281 | Tragic 81.0% |
| Aleuts | 0.0 /100 | #282 | Tragic 81.0% |
| French American Indians | 0.0 /100 | #283 | Tragic 80.8% |
| Belizeans | 0.0 /100 | #284 | Tragic 80.8% |
| Delaware | 0.0 /100 | #285 | Tragic 80.8% |
| Immigrants | Dominica | 0.0 /100 | #286 | Tragic 80.8% |
| Vietnamese | 0.0 /100 | #287 | Tragic 80.8% |
| Cree | 0.0 /100 | #288 | Tragic 80.8% |
| Immigrants | Bangladesh | 0.0 /100 | #289 | Tragic 80.7% |
Demographics Similar to Norwegians by In Labor Force | Age 45-54
In terms of in labor force | age 45-54, the demographic groups most similar to Norwegians are Immigrants from Sierra Leone (84.4%, a difference of 0.020%), Thai (84.3%, a difference of 0.090%), Sierra Leonean (84.5%, a difference of 0.13%), Bulgarian (84.2%, a difference of 0.20%), and Immigrants from Cameroon (84.6%, a difference of 0.24%).
| Demographics | Rating | Rank | In Labor Force | Age 45-54 |
| Bolivians | 100.0 /100 | #3 | Exceptional 84.9% |
| Immigrants | Ethiopia | 100.0 /100 | #4 | Exceptional 84.8% |
| Ethiopians | 100.0 /100 | #5 | Exceptional 84.8% |
| Immigrants | India | 100.0 /100 | #6 | Exceptional 84.7% |
| Immigrants | Cameroon | 100.0 /100 | #7 | Exceptional 84.6% |
| Sierra Leoneans | 100.0 /100 | #8 | Exceptional 84.5% |
| Immigrants | Sierra Leone | 100.0 /100 | #9 | Exceptional 84.4% |
| Norwegians | 100.0 /100 | #10 | Exceptional 84.4% |
| Thais | 100.0 /100 | #11 | Exceptional 84.3% |
| Bulgarians | 100.0 /100 | #12 | Exceptional 84.2% |
| Chinese | 99.9 /100 | #13 | Exceptional 84.1% |
| Cambodians | 99.9 /100 | #14 | Exceptional 84.1% |
| Cypriots | 99.9 /100 | #15 | Exceptional 84.1% |
| Immigrants | Nepal | 99.9 /100 | #16 | Exceptional 84.0% |
| Zimbabweans | 99.9 /100 | #17 | Exceptional 84.0% |