Mongolian vs Immigrants from Belgium In Labor Force | Age 45-54
COMPARE
Mongolian
Immigrants from Belgium
In Labor Force | Age 45-54
In Labor Force | Age 45-54 Comparison
Mongolians
Immigrants from Belgium
83.3%
IN LABOR FORCE | AGE 45-54
94.2/ 100
METRIC RATING
100th/ 347
METRIC RANK
83.1%
IN LABOR FORCE | AGE 45-54
86.4/ 100
METRIC RATING
126th/ 347
METRIC RANK
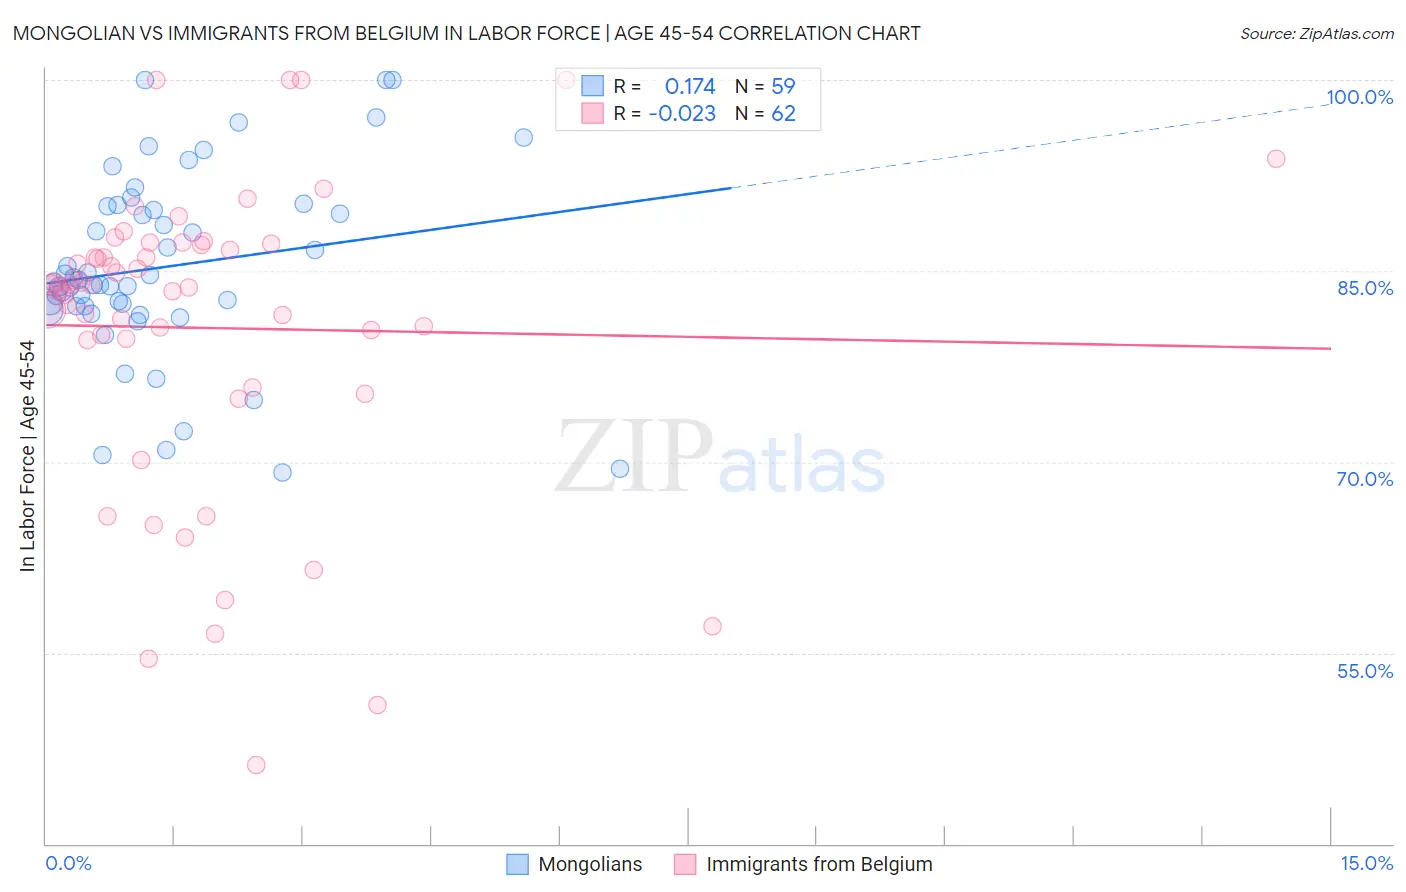
Mongolian vs Immigrants from Belgium In Labor Force | Age 45-54 Correlation Chart
The statistical analysis conducted on geographies consisting of 140,286,535 people shows a poor positive correlation between the proportion of Mongolians and labor force participation rate among population between the ages 45 and 54 in the United States with a correlation coefficient (R) of 0.174 and weighted average of 83.3%. Similarly, the statistical analysis conducted on geographies consisting of 146,695,450 people shows no correlation between the proportion of Immigrants from Belgium and labor force participation rate among population between the ages 45 and 54 in the United States with a correlation coefficient (R) of -0.023 and weighted average of 83.1%, a difference of 0.21%.
In Labor Force | Age 45-54 Correlation Summary
| Measurement | Mongolian | Immigrants from Belgium |
| Minimum | 69.2% | 46.2% |
| Maximum | 100.0% | 100.0% |
| Range | 30.8% | 53.8% |
| Mean | 85.3% | 80.5% |
| Median | 84.1% | 83.9% |
| Interquartile 25% (IQ1) | 82.2% | 79.6% |
| Interquartile 75% (IQ3) | 90.1% | 87.0% |
| Interquartile Range (IQR) | 7.9% | 7.4% |
| Standard Deviation (Sample) | 7.3% | 11.9% |
| Standard Deviation (Population) | 7.2% | 11.8% |
Similar Demographics by In Labor Force | Age 45-54
Demographics Similar to Mongolians by In Labor Force | Age 45-54
In terms of in labor force | age 45-54, the demographic groups most similar to Mongolians are Immigrants from Middle Africa (83.3%, a difference of 0.0%), Immigrants from Belarus (83.3%, a difference of 0.0%), Maltese (83.3%, a difference of 0.010%), Immigrants from Singapore (83.3%, a difference of 0.010%), and Albanian (83.3%, a difference of 0.010%).
| Demographics | Rating | Rank | In Labor Force | Age 45-54 |
| Italians | 95.1 /100 | #93 | Exceptional 83.3% |
| Argentineans | 94.9 /100 | #94 | Exceptional 83.3% |
| Immigrants | Argentina | 94.9 /100 | #95 | Exceptional 83.3% |
| Immigrants | Kuwait | 94.8 /100 | #96 | Exceptional 83.3% |
| Palestinians | 94.8 /100 | #97 | Exceptional 83.3% |
| Maltese | 94.4 /100 | #98 | Exceptional 83.3% |
| Immigrants | Middle Africa | 94.3 /100 | #99 | Exceptional 83.3% |
| Mongolians | 94.2 /100 | #100 | Exceptional 83.3% |
| Immigrants | Belarus | 94.1 /100 | #101 | Exceptional 83.3% |
| Immigrants | Singapore | 93.9 /100 | #102 | Exceptional 83.3% |
| Albanians | 93.9 /100 | #103 | Exceptional 83.3% |
| Immigrants | Romania | 93.8 /100 | #104 | Exceptional 83.3% |
| Immigrants | South America | 93.5 /100 | #105 | Exceptional 83.2% |
| Sri Lankans | 93.2 /100 | #106 | Exceptional 83.2% |
| Iranians | 92.9 /100 | #107 | Exceptional 83.2% |
Demographics Similar to Immigrants from Belgium by In Labor Force | Age 45-54
In terms of in labor force | age 45-54, the demographic groups most similar to Immigrants from Belgium are Immigrants from Iran (83.1%, a difference of 0.020%), Immigrants from Jordan (83.1%, a difference of 0.020%), German (83.1%, a difference of 0.020%), Immigrants from Northern Europe (83.1%, a difference of 0.020%), and Bermudan (83.1%, a difference of 0.030%).
| Demographics | Rating | Rank | In Labor Force | Age 45-54 |
| Immigrants | Uruguay | 90.2 /100 | #119 | Exceptional 83.2% |
| Immigrants | Russia | 90.1 /100 | #120 | Exceptional 83.2% |
| Uruguayans | 89.4 /100 | #121 | Excellent 83.1% |
| Immigrants | Vietnam | 88.9 /100 | #122 | Excellent 83.1% |
| Tongans | 88.2 /100 | #123 | Excellent 83.1% |
| Bermudans | 88.0 /100 | #124 | Excellent 83.1% |
| Immigrants | Iran | 87.2 /100 | #125 | Excellent 83.1% |
| Immigrants | Belgium | 86.4 /100 | #126 | Excellent 83.1% |
| Immigrants | Jordan | 85.2 /100 | #127 | Excellent 83.1% |
| Germans | 85.1 /100 | #128 | Excellent 83.1% |
| Immigrants | Northern Europe | 85.1 /100 | #129 | Excellent 83.1% |
| Immigrants | Israel | 84.7 /100 | #130 | Excellent 83.1% |
| Finns | 83.3 /100 | #131 | Excellent 83.1% |
| Immigrants | Ukraine | 82.9 /100 | #132 | Excellent 83.0% |
| Liberians | 82.7 /100 | #133 | Excellent 83.0% |