Albanian vs Immigrants from Dominica In Labor Force | Age 20-64
COMPARE
Albanian
Immigrants from Dominica
In Labor Force | Age 20-64
In Labor Force | Age 20-64 Comparison
Albanians
Immigrants from Dominica
80.2%
IN LABOR FORCE | AGE 20-64
98.6/ 100
METRIC RATING
69th/ 347
METRIC RANK
78.1%
IN LABOR FORCE | AGE 20-64
0.0/ 100
METRIC RATING
280th/ 347
METRIC RANK
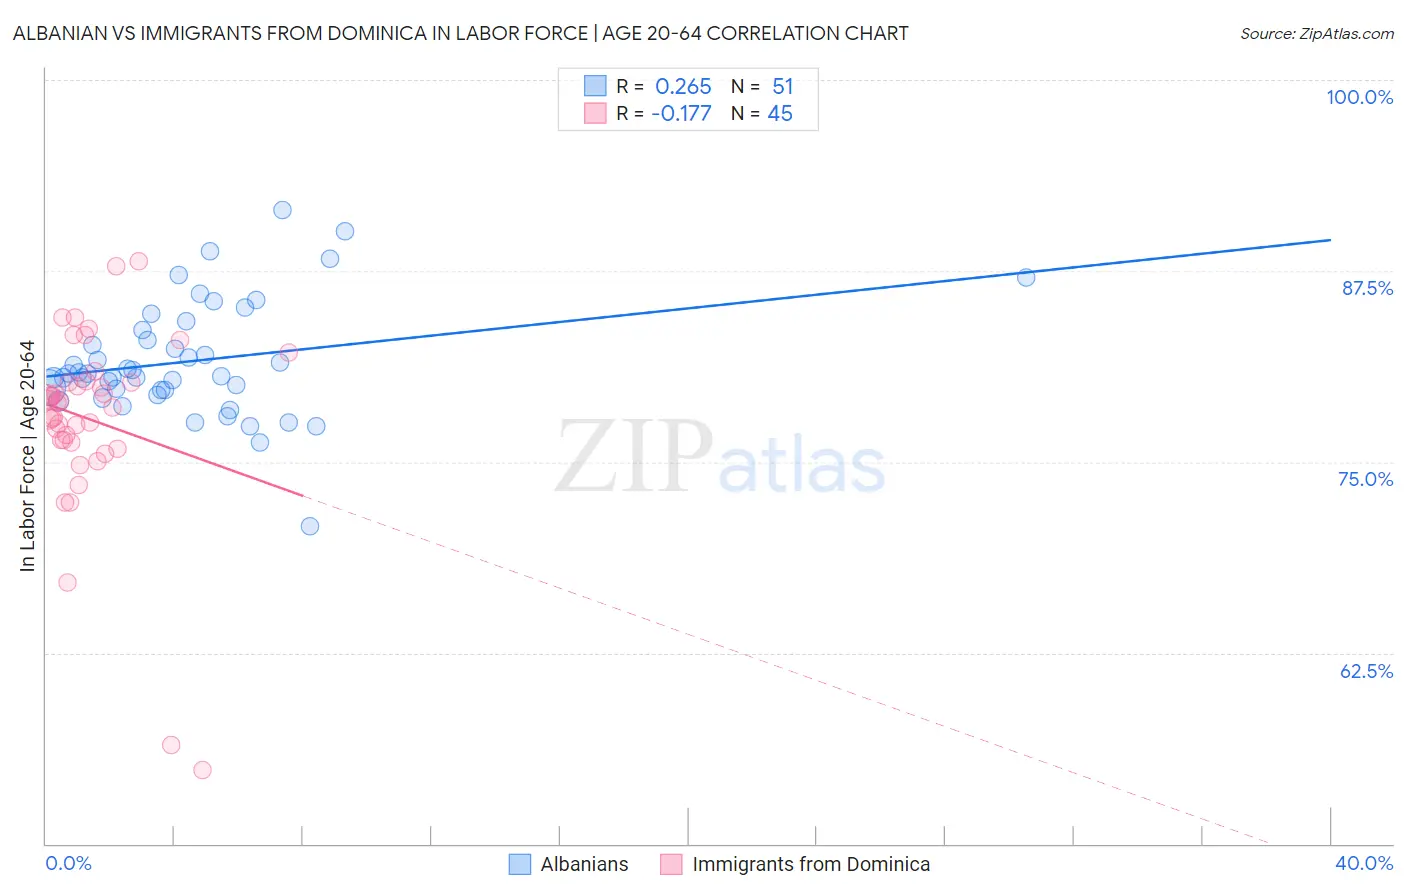
Albanian vs Immigrants from Dominica In Labor Force | Age 20-64 Correlation Chart
The statistical analysis conducted on geographies consisting of 193,264,914 people shows a weak positive correlation between the proportion of Albanians and labor force participation rate among population between the ages 20 and 64 in the United States with a correlation coefficient (R) of 0.265 and weighted average of 80.2%. Similarly, the statistical analysis conducted on geographies consisting of 83,787,194 people shows a poor negative correlation between the proportion of Immigrants from Dominica and labor force participation rate among population between the ages 20 and 64 in the United States with a correlation coefficient (R) of -0.177 and weighted average of 78.1%, a difference of 2.7%.
In Labor Force | Age 20-64 Correlation Summary
| Measurement | Albanian | Immigrants from Dominica |
| Minimum | 70.8% | 54.8% |
| Maximum | 91.5% | 88.1% |
| Range | 20.7% | 33.3% |
| Mean | 81.6% | 77.8% |
| Median | 80.8% | 78.9% |
| Interquartile 25% (IQ1) | 79.7% | 76.4% |
| Interquartile 75% (IQ3) | 83.7% | 80.3% |
| Interquartile Range (IQR) | 3.9% | 3.9% |
| Standard Deviation (Sample) | 3.8% | 6.2% |
| Standard Deviation (Population) | 3.7% | 6.1% |
Similar Demographics by In Labor Force | Age 20-64
Demographics Similar to Albanians by In Labor Force | Age 20-64
In terms of in labor force | age 20-64, the demographic groups most similar to Albanians are Bhutanese (80.2%, a difference of 0.0%), Immigrants from Turkey (80.2%, a difference of 0.0%), Macedonian (80.2%, a difference of 0.010%), Taiwanese (80.2%, a difference of 0.010%), and Soviet Union (80.2%, a difference of 0.010%).
| Demographics | Rating | Rank | In Labor Force | Age 20-64 |
| Carpatho Rusyns | 98.8 /100 | #62 | Exceptional 80.3% |
| Immigrants | Korea | 98.8 /100 | #63 | Exceptional 80.3% |
| Immigrants | Albania | 98.7 /100 | #64 | Exceptional 80.3% |
| Lithuanians | 98.7 /100 | #65 | Exceptional 80.2% |
| Macedonians | 98.7 /100 | #66 | Exceptional 80.2% |
| Taiwanese | 98.6 /100 | #67 | Exceptional 80.2% |
| Bhutanese | 98.6 /100 | #68 | Exceptional 80.2% |
| Albanians | 98.6 /100 | #69 | Exceptional 80.2% |
| Immigrants | Turkey | 98.5 /100 | #70 | Exceptional 80.2% |
| Soviet Union | 98.5 /100 | #71 | Exceptional 80.2% |
| Eastern Europeans | 98.4 /100 | #72 | Exceptional 80.2% |
| Cypriots | 98.2 /100 | #73 | Exceptional 80.2% |
| Immigrants | Eastern Europe | 98.1 /100 | #74 | Exceptional 80.2% |
| Immigrants | Afghanistan | 97.9 /100 | #75 | Exceptional 80.2% |
| Egyptians | 97.8 /100 | #76 | Exceptional 80.2% |
Demographics Similar to Immigrants from Dominica by In Labor Force | Age 20-64
In terms of in labor force | age 20-64, the demographic groups most similar to Immigrants from Dominica are Guyanese (78.1%, a difference of 0.030%), Belizean (78.2%, a difference of 0.040%), Immigrants from St. Vincent and the Grenadines (78.1%, a difference of 0.050%), Nonimmigrants (78.1%, a difference of 0.060%), and Immigrants from Guyana (78.1%, a difference of 0.080%).
| Demographics | Rating | Rank | In Labor Force | Age 20-64 |
| French American Indians | 0.0 /100 | #273 | Tragic 78.2% |
| Aleuts | 0.0 /100 | #274 | Tragic 78.2% |
| Spanish | 0.0 /100 | #275 | Tragic 78.2% |
| Puget Sound Salish | 0.0 /100 | #276 | Tragic 78.2% |
| Immigrants | Bahamas | 0.0 /100 | #277 | Tragic 78.2% |
| Mexican American Indians | 0.0 /100 | #278 | Tragic 78.2% |
| Belizeans | 0.0 /100 | #279 | Tragic 78.2% |
| Immigrants | Dominica | 0.0 /100 | #280 | Tragic 78.1% |
| Guyanese | 0.0 /100 | #281 | Tragic 78.1% |
| Immigrants | St. Vincent and the Grenadines | 0.0 /100 | #282 | Tragic 78.1% |
| Immigrants | Nonimmigrants | 0.0 /100 | #283 | Tragic 78.1% |
| Immigrants | Guyana | 0.0 /100 | #284 | Tragic 78.1% |
| Osage | 0.0 /100 | #285 | Tragic 78.0% |
| Immigrants | Belize | 0.0 /100 | #286 | Tragic 78.0% |
| Vietnamese | 0.0 /100 | #287 | Tragic 78.0% |