Albanian vs Immigrants from Ukraine In Labor Force | Age 20-64
COMPARE
Albanian
Immigrants from Ukraine
In Labor Force | Age 20-64
In Labor Force | Age 20-64 Comparison
Albanians
Immigrants from Ukraine
80.2%
IN LABOR FORCE | AGE 20-64
98.6/ 100
METRIC RATING
69th/ 347
METRIC RANK
79.9%
IN LABOR FORCE | AGE 20-64
86.5/ 100
METRIC RATING
137th/ 347
METRIC RANK
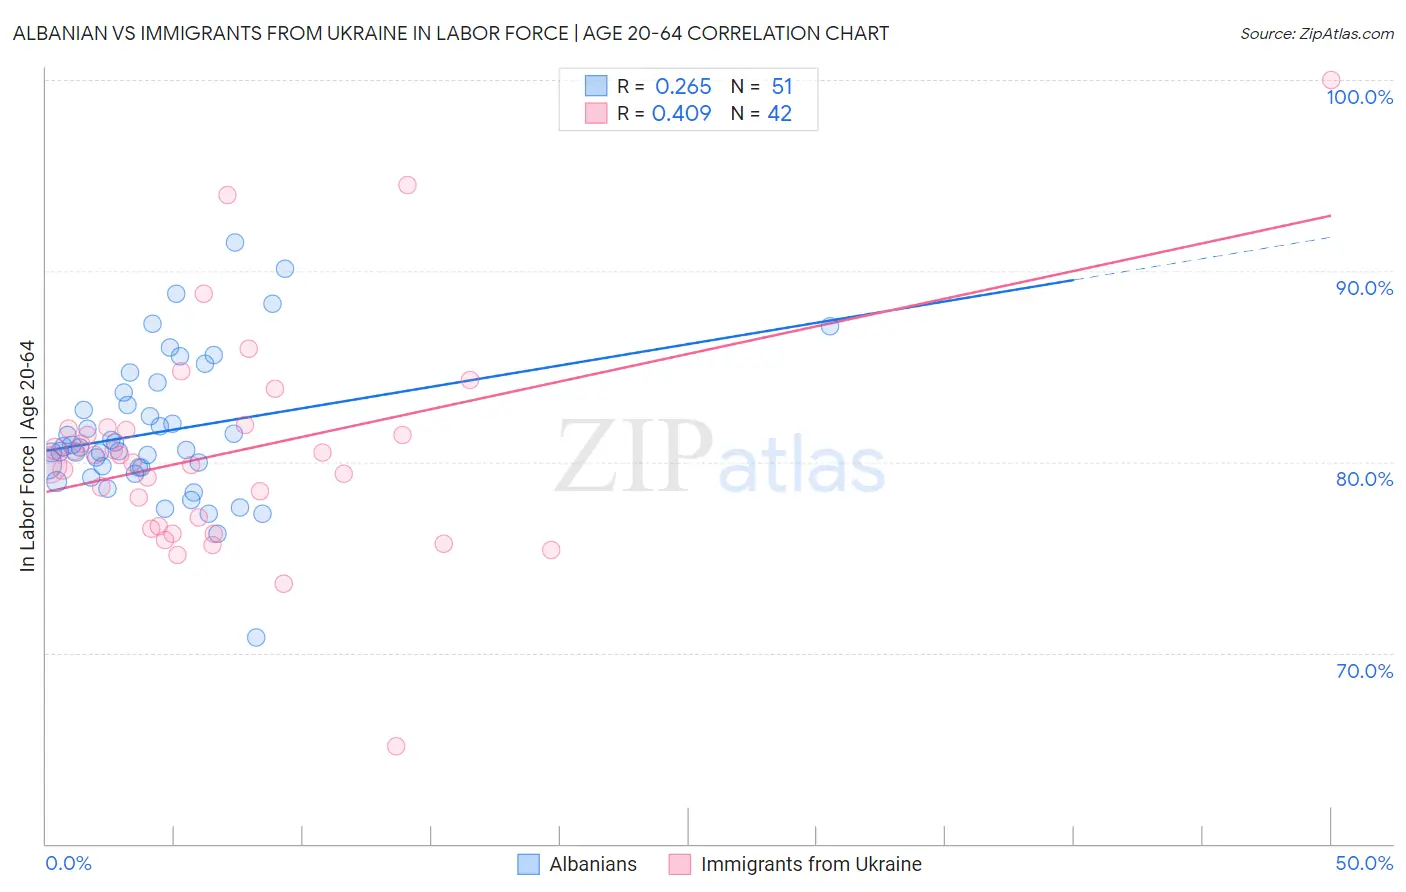
Albanian vs Immigrants from Ukraine In Labor Force | Age 20-64 Correlation Chart
The statistical analysis conducted on geographies consisting of 193,264,914 people shows a weak positive correlation between the proportion of Albanians and labor force participation rate among population between the ages 20 and 64 in the United States with a correlation coefficient (R) of 0.265 and weighted average of 80.2%. Similarly, the statistical analysis conducted on geographies consisting of 289,706,757 people shows a moderate positive correlation between the proportion of Immigrants from Ukraine and labor force participation rate among population between the ages 20 and 64 in the United States with a correlation coefficient (R) of 0.409 and weighted average of 79.9%, a difference of 0.47%.
In Labor Force | Age 20-64 Correlation Summary
| Measurement | Albanian | Immigrants from Ukraine |
| Minimum | 70.8% | 65.1% |
| Maximum | 91.5% | 100.0% |
| Range | 20.7% | 34.9% |
| Mean | 81.6% | 80.5% |
| Median | 80.8% | 80.1% |
| Interquartile 25% (IQ1) | 79.7% | 76.6% |
| Interquartile 75% (IQ3) | 83.7% | 81.8% |
| Interquartile Range (IQR) | 3.9% | 5.1% |
| Standard Deviation (Sample) | 3.8% | 5.9% |
| Standard Deviation (Population) | 3.7% | 5.8% |
Similar Demographics by In Labor Force | Age 20-64
Demographics Similar to Albanians by In Labor Force | Age 20-64
In terms of in labor force | age 20-64, the demographic groups most similar to Albanians are Bhutanese (80.2%, a difference of 0.0%), Immigrants from Turkey (80.2%, a difference of 0.0%), Macedonian (80.2%, a difference of 0.010%), Taiwanese (80.2%, a difference of 0.010%), and Soviet Union (80.2%, a difference of 0.010%).
| Demographics | Rating | Rank | In Labor Force | Age 20-64 |
| Carpatho Rusyns | 98.8 /100 | #62 | Exceptional 80.3% |
| Immigrants | Korea | 98.8 /100 | #63 | Exceptional 80.3% |
| Immigrants | Albania | 98.7 /100 | #64 | Exceptional 80.3% |
| Lithuanians | 98.7 /100 | #65 | Exceptional 80.2% |
| Macedonians | 98.7 /100 | #66 | Exceptional 80.2% |
| Taiwanese | 98.6 /100 | #67 | Exceptional 80.2% |
| Bhutanese | 98.6 /100 | #68 | Exceptional 80.2% |
| Albanians | 98.6 /100 | #69 | Exceptional 80.2% |
| Immigrants | Turkey | 98.5 /100 | #70 | Exceptional 80.2% |
| Soviet Union | 98.5 /100 | #71 | Exceptional 80.2% |
| Eastern Europeans | 98.4 /100 | #72 | Exceptional 80.2% |
| Cypriots | 98.2 /100 | #73 | Exceptional 80.2% |
| Immigrants | Eastern Europe | 98.1 /100 | #74 | Exceptional 80.2% |
| Immigrants | Afghanistan | 97.9 /100 | #75 | Exceptional 80.2% |
| Egyptians | 97.8 /100 | #76 | Exceptional 80.2% |
Demographics Similar to Immigrants from Ukraine by In Labor Force | Age 20-64
In terms of in labor force | age 20-64, the demographic groups most similar to Immigrants from Ukraine are Immigrants from Singapore (79.9%, a difference of 0.0%), Immigrants from Nigeria (79.9%, a difference of 0.0%), Ukrainian (79.9%, a difference of 0.010%), Indian (Asian) (79.9%, a difference of 0.020%), and South American Indian (79.9%, a difference of 0.020%).
| Demographics | Rating | Rank | In Labor Force | Age 20-64 |
| Immigrants | Zaire | 88.6 /100 | #130 | Excellent 79.9% |
| Immigrants | Iran | 88.3 /100 | #131 | Excellent 79.9% |
| Indians (Asian) | 87.7 /100 | #132 | Excellent 79.9% |
| South American Indians | 87.6 /100 | #133 | Excellent 79.9% |
| Belgians | 87.4 /100 | #134 | Excellent 79.9% |
| Ukrainians | 86.8 /100 | #135 | Excellent 79.9% |
| Immigrants | Singapore | 86.7 /100 | #136 | Excellent 79.9% |
| Immigrants | Ukraine | 86.5 /100 | #137 | Excellent 79.9% |
| Immigrants | Nigeria | 86.4 /100 | #138 | Excellent 79.9% |
| Immigrants | Spain | 83.9 /100 | #139 | Excellent 79.8% |
| Immigrants | South Eastern Asia | 80.4 /100 | #140 | Excellent 79.8% |
| Immigrants | Israel | 80.0 /100 | #141 | Good 79.8% |
| Slovaks | 79.9 /100 | #142 | Good 79.8% |
| Immigrants | Sweden | 79.7 /100 | #143 | Good 79.8% |
| Koreans | 79.6 /100 | #144 | Good 79.8% |