Alaskan Athabascan vs Immigrants from South Eastern Asia 5th Grade
COMPARE
Alaskan Athabascan
Immigrants from South Eastern Asia
5th Grade
5th Grade Comparison
Alaskan Athabascans
Immigrants from South Eastern Asia
98.3%
5TH GRADE
100.0/ 100
METRIC RATING
11th/ 347
METRIC RANK
96.3%
5TH GRADE
0.0/ 100
METRIC RATING
296th/ 347
METRIC RANK
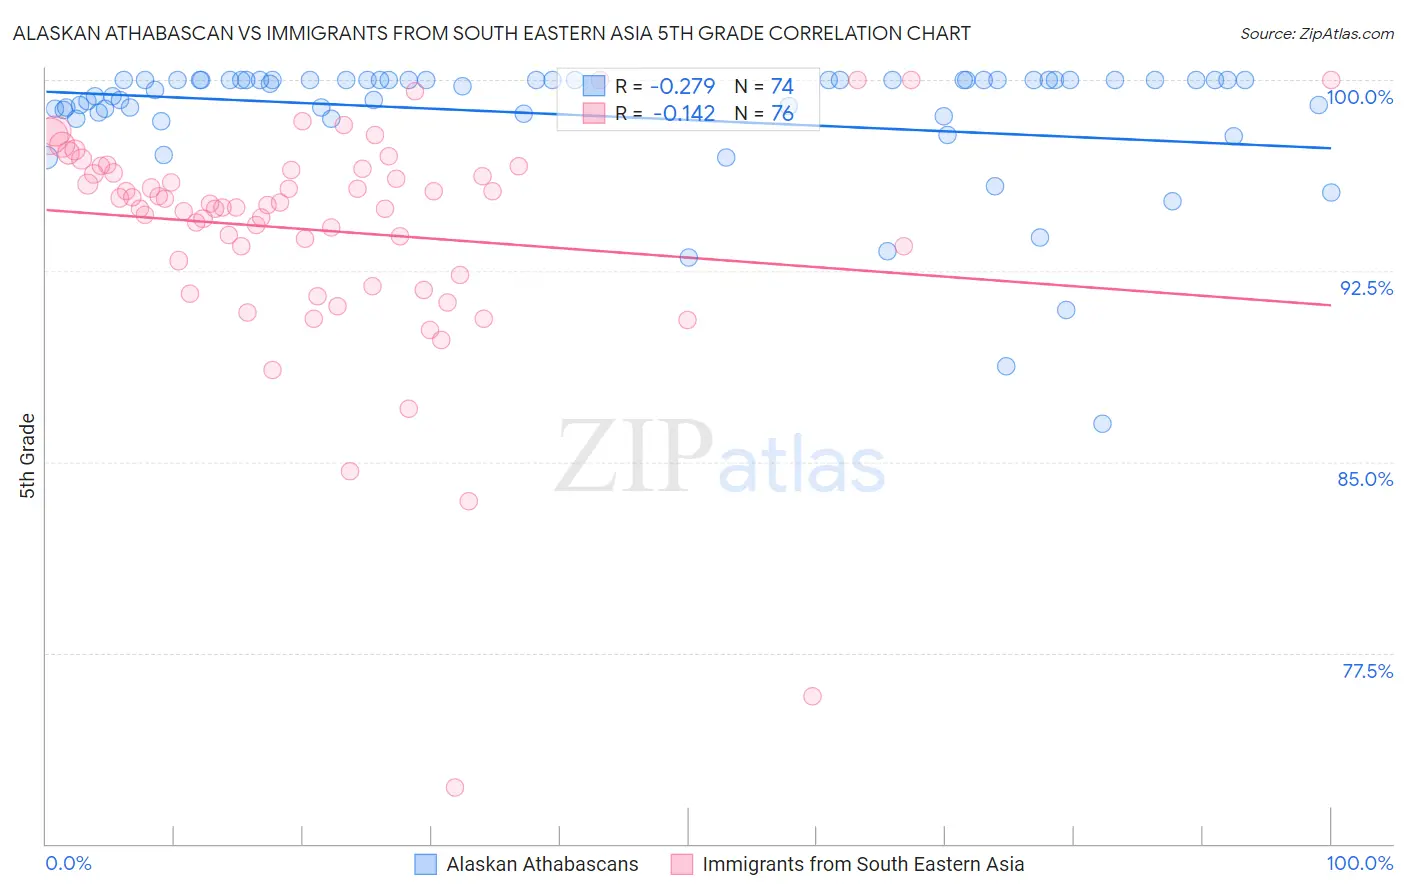
Alaskan Athabascan vs Immigrants from South Eastern Asia 5th Grade Correlation Chart
The statistical analysis conducted on geographies consisting of 45,820,365 people shows a weak negative correlation between the proportion of Alaskan Athabascans and percentage of population with at least 5th grade education in the United States with a correlation coefficient (R) of -0.279 and weighted average of 98.3%. Similarly, the statistical analysis conducted on geographies consisting of 512,710,223 people shows a poor negative correlation between the proportion of Immigrants from South Eastern Asia and percentage of population with at least 5th grade education in the United States with a correlation coefficient (R) of -0.142 and weighted average of 96.3%, a difference of 2.1%.
5th Grade Correlation Summary
| Measurement | Alaskan Athabascan | Immigrants from South Eastern Asia |
| Minimum | 86.5% | 72.2% |
| Maximum | 100.0% | 100.0% |
| Range | 13.5% | 27.8% |
| Mean | 98.6% | 94.1% |
| Median | 99.9% | 95.1% |
| Interquartile 25% (IQ1) | 98.7% | 92.6% |
| Interquartile 75% (IQ3) | 100.0% | 96.5% |
| Interquartile Range (IQR) | 1.3% | 3.9% |
| Standard Deviation (Sample) | 2.6% | 4.6% |
| Standard Deviation (Population) | 2.6% | 4.6% |
Similar Demographics by 5th Grade
Demographics Similar to Alaskan Athabascans by 5th Grade
In terms of 5th grade, the demographic groups most similar to Alaskan Athabascans are Swedish (98.3%, a difference of 0.0%), English (98.3%, a difference of 0.0%), Carpatho Rusyn (98.3%, a difference of 0.010%), Tlingit-Haida (98.3%, a difference of 0.020%), and Dutch (98.3%, a difference of 0.030%).
| Demographics | Rating | Rank | 5th Grade |
| Tsimshian | 100.0 /100 | #4 | Exceptional 98.4% |
| Slovaks | 100.0 /100 | #5 | Exceptional 98.4% |
| Germans | 100.0 /100 | #6 | Exceptional 98.4% |
| Inupiat | 100.0 /100 | #7 | Exceptional 98.4% |
| Slovenes | 100.0 /100 | #8 | Exceptional 98.3% |
| Swedes | 100.0 /100 | #9 | Exceptional 98.3% |
| English | 100.0 /100 | #10 | Exceptional 98.3% |
| Alaskan Athabascans | 100.0 /100 | #11 | Exceptional 98.3% |
| Carpatho Rusyns | 100.0 /100 | #12 | Exceptional 98.3% |
| Tlingit-Haida | 100.0 /100 | #13 | Exceptional 98.3% |
| Dutch | 100.0 /100 | #14 | Exceptional 98.3% |
| Scottish | 100.0 /100 | #15 | Exceptional 98.3% |
| Poles | 100.0 /100 | #16 | Exceptional 98.3% |
| Irish | 100.0 /100 | #17 | Exceptional 98.3% |
| Pennsylvania Germans | 100.0 /100 | #18 | Exceptional 98.3% |
Demographics Similar to Immigrants from South Eastern Asia by 5th Grade
In terms of 5th grade, the demographic groups most similar to Immigrants from South Eastern Asia are Haitian (96.3%, a difference of 0.030%), Immigrants from Dominica (96.2%, a difference of 0.080%), Immigrants from Somalia (96.4%, a difference of 0.10%), Immigrants (96.2%, a difference of 0.11%), and Immigrants from Eritrea (96.4%, a difference of 0.14%).
| Demographics | Rating | Rank | 5th Grade |
| Immigrants | West Indies | 0.0 /100 | #289 | Tragic 96.5% |
| British West Indians | 0.0 /100 | #290 | Tragic 96.5% |
| Malaysians | 0.0 /100 | #291 | Tragic 96.5% |
| Somalis | 0.0 /100 | #292 | Tragic 96.5% |
| Immigrants | Grenada | 0.0 /100 | #293 | Tragic 96.5% |
| Immigrants | Eritrea | 0.0 /100 | #294 | Tragic 96.4% |
| Immigrants | Somalia | 0.0 /100 | #295 | Tragic 96.4% |
| Immigrants | South Eastern Asia | 0.0 /100 | #296 | Tragic 96.3% |
| Haitians | 0.0 /100 | #297 | Tragic 96.3% |
| Immigrants | Dominica | 0.0 /100 | #298 | Tragic 96.2% |
| Immigrants | Immigrants | 0.0 /100 | #299 | Tragic 96.2% |
| Sri Lankans | 0.0 /100 | #300 | Tragic 96.1% |
| Immigrants | Cuba | 0.0 /100 | #301 | Tragic 96.1% |
| Guyanese | 0.0 /100 | #302 | Tragic 96.1% |
| Puerto Ricans | 0.0 /100 | #303 | Tragic 96.1% |