Alaskan Athabascan vs Immigrants from South Eastern Asia 9th Grade
COMPARE
Alaskan Athabascan
Immigrants from South Eastern Asia
9th Grade
9th Grade Comparison
Alaskan Athabascans
Immigrants from South Eastern Asia
96.4%
9TH GRADE
100.0/ 100
METRIC RATING
21st/ 347
METRIC RANK
93.3%
9TH GRADE
0.0/ 100
METRIC RATING
288th/ 347
METRIC RANK
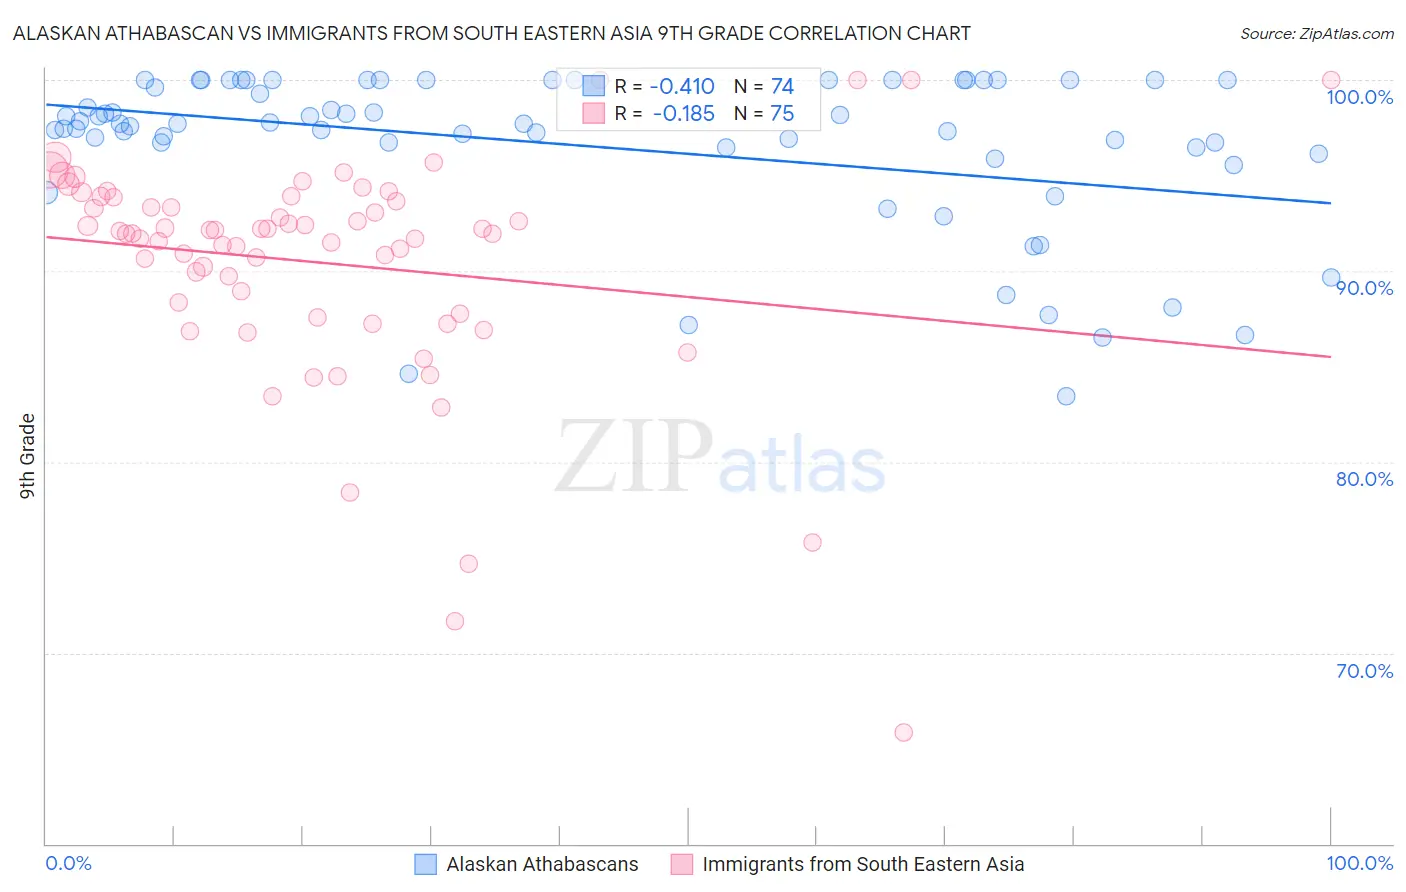
Alaskan Athabascan vs Immigrants from South Eastern Asia 9th Grade Correlation Chart
The statistical analysis conducted on geographies consisting of 45,820,365 people shows a moderate negative correlation between the proportion of Alaskan Athabascans and percentage of population with at least 9th grade education in the United States with a correlation coefficient (R) of -0.410 and weighted average of 96.4%. Similarly, the statistical analysis conducted on geographies consisting of 512,709,822 people shows a poor negative correlation between the proportion of Immigrants from South Eastern Asia and percentage of population with at least 9th grade education in the United States with a correlation coefficient (R) of -0.185 and weighted average of 93.3%, a difference of 3.3%.
9th Grade Correlation Summary
| Measurement | Alaskan Athabascan | Immigrants from South Eastern Asia |
| Minimum | 83.5% | 65.9% |
| Maximum | 100.0% | 100.0% |
| Range | 16.5% | 34.1% |
| Mean | 96.5% | 90.4% |
| Median | 97.7% | 92.0% |
| Interquartile 25% (IQ1) | 96.4% | 87.8% |
| Interquartile 75% (IQ3) | 100.0% | 93.9% |
| Interquartile Range (IQR) | 3.6% | 6.1% |
| Standard Deviation (Sample) | 4.2% | 6.0% |
| Standard Deviation (Population) | 4.1% | 5.9% |
Similar Demographics by 9th Grade
Demographics Similar to Alaskan Athabascans by 9th Grade
In terms of 9th grade, the demographic groups most similar to Alaskan Athabascans are Italian (96.4%, a difference of 0.010%), European (96.4%, a difference of 0.010%), Welsh (96.4%, a difference of 0.020%), Czech (96.4%, a difference of 0.020%), and Scandinavian (96.5%, a difference of 0.050%).
| Demographics | Rating | Rank | 9th Grade |
| Scottish | 100.0 /100 | #14 | Exceptional 96.5% |
| Irish | 100.0 /100 | #15 | Exceptional 96.5% |
| Croatians | 100.0 /100 | #16 | Exceptional 96.5% |
| Dutch | 100.0 /100 | #17 | Exceptional 96.5% |
| Scandinavians | 100.0 /100 | #18 | Exceptional 96.5% |
| Welsh | 100.0 /100 | #19 | Exceptional 96.4% |
| Italians | 100.0 /100 | #20 | Exceptional 96.4% |
| Alaskan Athabascans | 100.0 /100 | #21 | Exceptional 96.4% |
| Europeans | 100.0 /100 | #22 | Exceptional 96.4% |
| Czechs | 100.0 /100 | #23 | Exceptional 96.4% |
| Latvians | 100.0 /100 | #24 | Exceptional 96.4% |
| French | 100.0 /100 | #25 | Exceptional 96.3% |
| French Canadians | 100.0 /100 | #26 | Exceptional 96.3% |
| Scotch-Irish | 100.0 /100 | #27 | Exceptional 96.3% |
| Eastern Europeans | 100.0 /100 | #28 | Exceptional 96.3% |
Demographics Similar to Immigrants from South Eastern Asia by 9th Grade
In terms of 9th grade, the demographic groups most similar to Immigrants from South Eastern Asia are Immigrants from St. Vincent and the Grenadines (93.4%, a difference of 0.030%), Immigrants from Barbados (93.4%, a difference of 0.040%), Immigrants from West Indies (93.3%, a difference of 0.060%), Immigrants from Peru (93.4%, a difference of 0.070%), and Pennsylvania German (93.3%, a difference of 0.070%).
| Demographics | Rating | Rank | 9th Grade |
| Immigrants | Trinidad and Tobago | 0.1 /100 | #281 | Tragic 93.6% |
| Malaysians | 0.0 /100 | #282 | Tragic 93.5% |
| Barbadians | 0.0 /100 | #283 | Tragic 93.5% |
| Bangladeshis | 0.0 /100 | #284 | Tragic 93.4% |
| Immigrants | Peru | 0.0 /100 | #285 | Tragic 93.4% |
| Immigrants | Barbados | 0.0 /100 | #286 | Tragic 93.4% |
| Immigrants | St. Vincent and the Grenadines | 0.0 /100 | #287 | Tragic 93.4% |
| Immigrants | South Eastern Asia | 0.0 /100 | #288 | Tragic 93.3% |
| Immigrants | West Indies | 0.0 /100 | #289 | Tragic 93.3% |
| Pennsylvania Germans | 0.0 /100 | #290 | Tragic 93.3% |
| British West Indians | 0.0 /100 | #291 | Tragic 93.2% |
| Immigrants | Laos | 0.0 /100 | #292 | Tragic 93.2% |
| Sri Lankans | 0.0 /100 | #293 | Tragic 93.2% |
| Cubans | 0.0 /100 | #294 | Tragic 93.2% |
| Immigrants | Burma/Myanmar | 0.0 /100 | #295 | Tragic 93.1% |