Alaskan Athabascan vs Immigrants from Caribbean In Labor Force | Age 45-54
COMPARE
Alaskan Athabascan
Immigrants from Caribbean
In Labor Force | Age 45-54
In Labor Force | Age 45-54 Comparison
Alaskan Athabascans
Immigrants from Caribbean
81.8%
IN LABOR FORCE | AGE 45-54
0.4/ 100
METRIC RATING
246th/ 347
METRIC RANK
82.1%
IN LABOR FORCE | AGE 45-54
2.5/ 100
METRIC RATING
226th/ 347
METRIC RANK
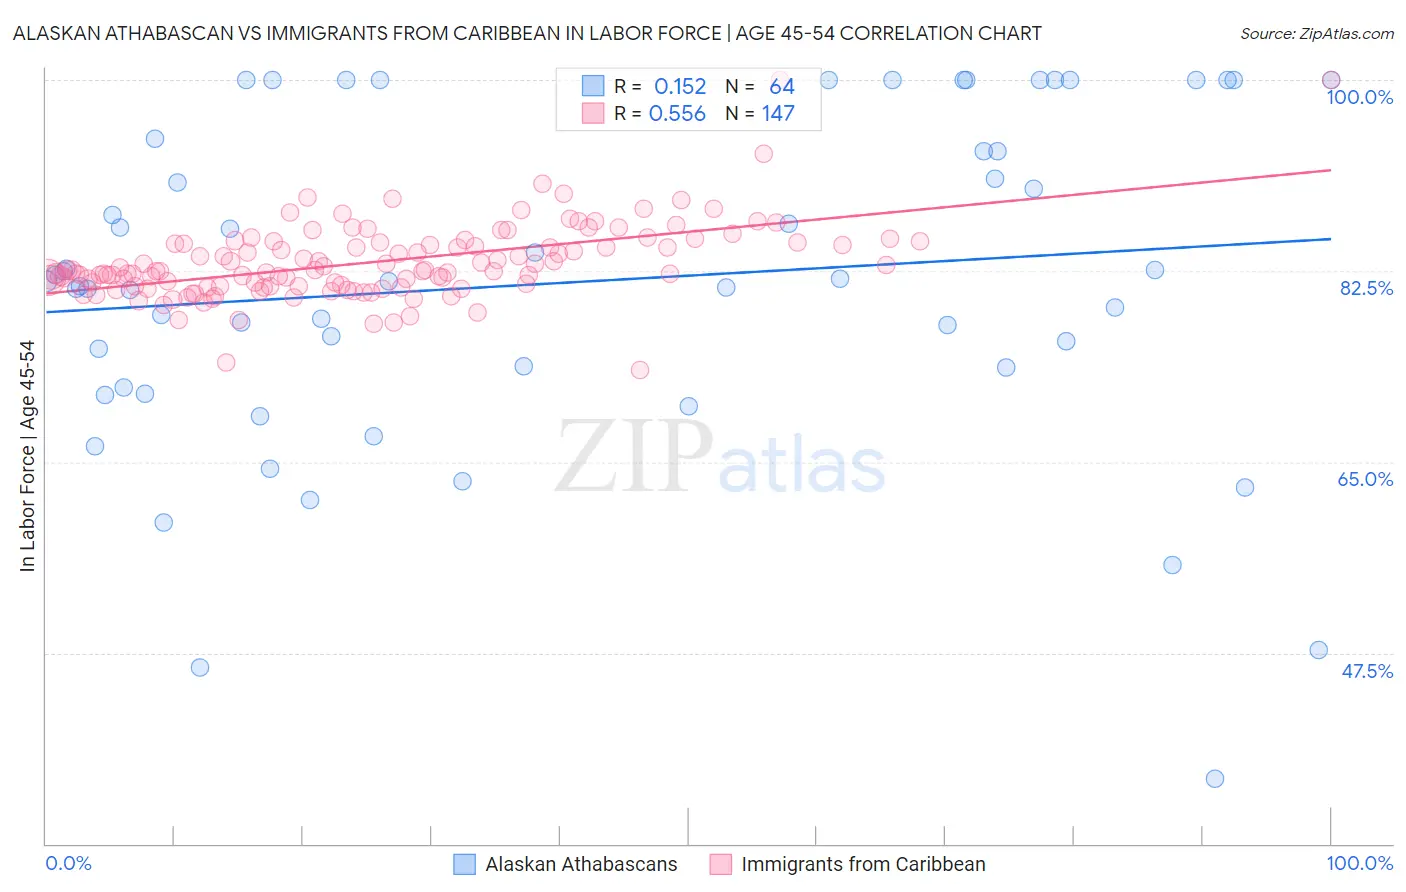
Alaskan Athabascan vs Immigrants from Caribbean In Labor Force | Age 45-54 Correlation Chart
The statistical analysis conducted on geographies consisting of 45,818,095 people shows a poor positive correlation between the proportion of Alaskan Athabascans and labor force participation rate among population between the ages 45 and 54 in the United States with a correlation coefficient (R) of 0.152 and weighted average of 81.8%. Similarly, the statistical analysis conducted on geographies consisting of 449,588,789 people shows a substantial positive correlation between the proportion of Immigrants from Caribbean and labor force participation rate among population between the ages 45 and 54 in the United States with a correlation coefficient (R) of 0.556 and weighted average of 82.1%, a difference of 0.41%.
In Labor Force | Age 45-54 Correlation Summary
| Measurement | Alaskan Athabascan | Immigrants from Caribbean |
| Minimum | 36.0% | 73.4% |
| Maximum | 100.0% | 100.0% |
| Range | 64.0% | 26.6% |
| Mean | 81.5% | 83.3% |
| Median | 81.5% | 82.5% |
| Interquartile 25% (IQ1) | 72.8% | 81.1% |
| Interquartile 75% (IQ3) | 94.1% | 85.1% |
| Interquartile Range (IQR) | 21.3% | 4.0% |
| Standard Deviation (Sample) | 15.0% | 3.6% |
| Standard Deviation (Population) | 14.9% | 3.5% |
Demographics Similar to Alaskan Athabascans and Immigrants from Caribbean by In Labor Force | Age 45-54
In terms of in labor force | age 45-54, the demographic groups most similar to Alaskan Athabascans are Alaska Native (81.8%, a difference of 0.010%), Celtic (81.8%, a difference of 0.020%), Samoan (81.8%, a difference of 0.11%), White/Caucasian (81.9%, a difference of 0.12%), and Immigrants from Cambodia (81.9%, a difference of 0.16%). Similarly, the demographic groups most similar to Immigrants from Caribbean are Immigrants from Germany (82.1%, a difference of 0.010%), Cape Verdean (82.1%, a difference of 0.040%), Immigrants from Burma/Myanmar (82.0%, a difference of 0.060%), Jamaican (82.0%, a difference of 0.070%), and Immigrants from Senegal (82.0%, a difference of 0.090%).
| Demographics | Rating | Rank | In Labor Force | Age 45-54 |
| Immigrants | Caribbean | 2.5 /100 | #226 | Tragic 82.1% |
| Immigrants | Germany | 2.4 /100 | #227 | Tragic 82.1% |
| Cape Verdeans | 2.1 /100 | #228 | Tragic 82.1% |
| Immigrants | Burma/Myanmar | 1.9 /100 | #229 | Tragic 82.0% |
| Jamaicans | 1.8 /100 | #230 | Tragic 82.0% |
| Immigrants | Senegal | 1.7 /100 | #231 | Tragic 82.0% |
| Immigrants | Portugal | 1.7 /100 | #232 | Tragic 82.0% |
| Malaysians | 1.7 /100 | #233 | Tragic 82.0% |
| Salvadorans | 1.7 /100 | #234 | Tragic 82.0% |
| Sub-Saharan Africans | 1.2 /100 | #235 | Tragic 82.0% |
| Basques | 1.2 /100 | #236 | Tragic 82.0% |
| Immigrants | Trinidad and Tobago | 1.2 /100 | #237 | Tragic 82.0% |
| Trinidadians and Tobagonians | 1.1 /100 | #238 | Tragic 81.9% |
| Immigrants | Thailand | 1.0 /100 | #239 | Tragic 81.9% |
| Immigrants | El Salvador | 1.0 /100 | #240 | Tragic 81.9% |
| Immigrants | Cambodia | 0.8 /100 | #241 | Tragic 81.9% |
| Whites/Caucasians | 0.7 /100 | #242 | Tragic 81.9% |
| Samoans | 0.6 /100 | #243 | Tragic 81.8% |
| Celtics | 0.4 /100 | #244 | Tragic 81.8% |
| Alaska Natives | 0.4 /100 | #245 | Tragic 81.8% |
| Alaskan Athabascans | 0.4 /100 | #246 | Tragic 81.8% |