Alaskan Athabascan vs Eastern European In Labor Force | Age 45-54
COMPARE
Alaskan Athabascan
Eastern European
In Labor Force | Age 45-54
In Labor Force | Age 45-54 Comparison
Alaskan Athabascans
Eastern Europeans
81.8%
IN LABOR FORCE | AGE 45-54
0.4/ 100
METRIC RATING
246th/ 347
METRIC RANK
83.5%
IN LABOR FORCE | AGE 45-54
98.5/ 100
METRIC RATING
58th/ 347
METRIC RANK
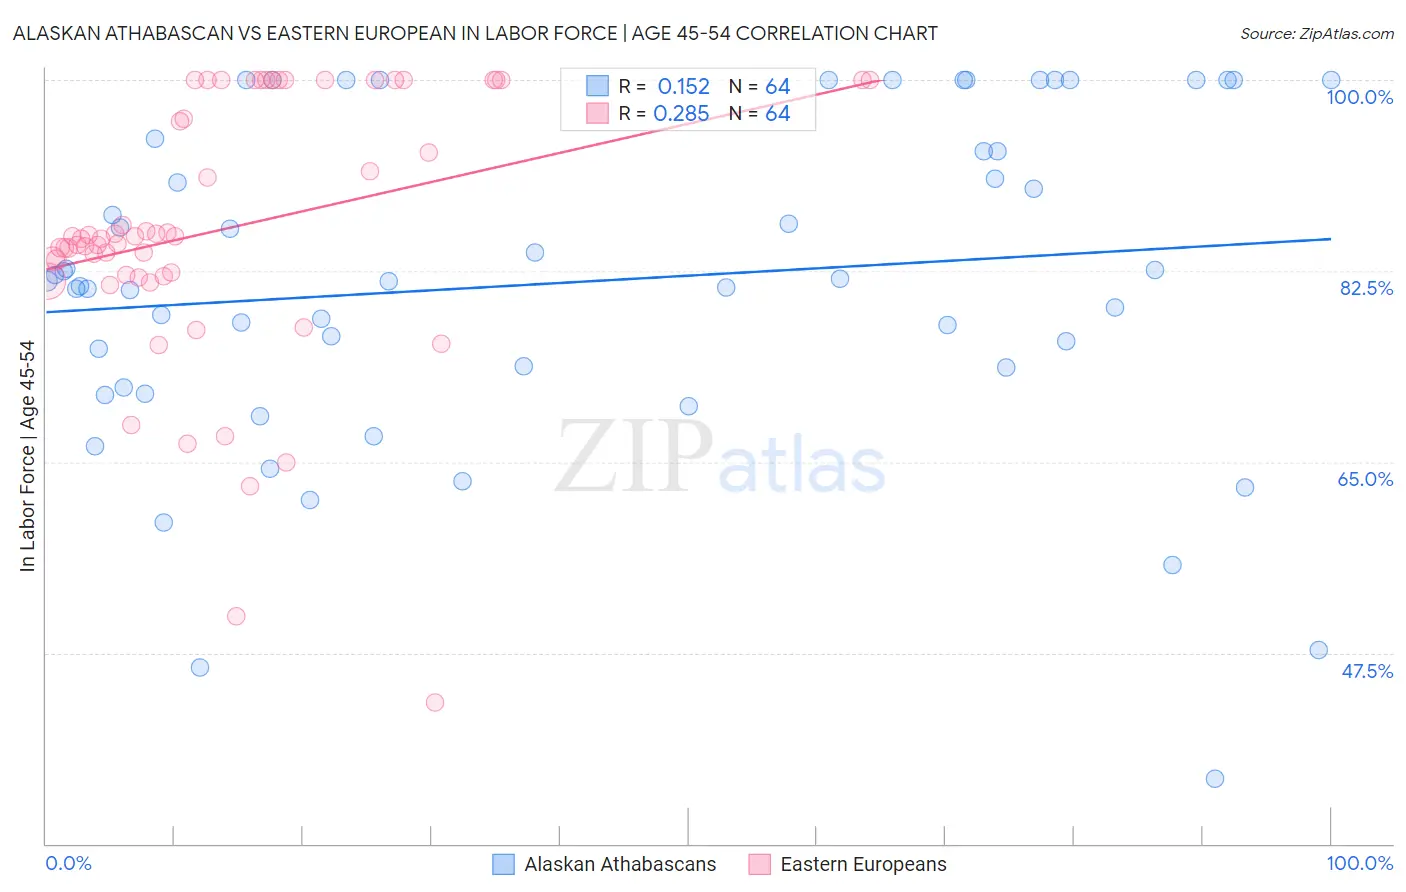
Alaskan Athabascan vs Eastern European In Labor Force | Age 45-54 Correlation Chart
The statistical analysis conducted on geographies consisting of 45,818,095 people shows a poor positive correlation between the proportion of Alaskan Athabascans and labor force participation rate among population between the ages 45 and 54 in the United States with a correlation coefficient (R) of 0.152 and weighted average of 81.8%. Similarly, the statistical analysis conducted on geographies consisting of 460,921,297 people shows a weak positive correlation between the proportion of Eastern Europeans and labor force participation rate among population between the ages 45 and 54 in the United States with a correlation coefficient (R) of 0.285 and weighted average of 83.5%, a difference of 2.2%.
In Labor Force | Age 45-54 Correlation Summary
| Measurement | Alaskan Athabascan | Eastern European |
| Minimum | 36.0% | 42.9% |
| Maximum | 100.0% | 100.0% |
| Range | 64.0% | 57.1% |
| Mean | 81.5% | 86.4% |
| Median | 81.5% | 85.6% |
| Interquartile 25% (IQ1) | 72.8% | 82.0% |
| Interquartile 75% (IQ3) | 94.1% | 100.0% |
| Interquartile Range (IQR) | 21.3% | 18.0% |
| Standard Deviation (Sample) | 15.0% | 12.3% |
| Standard Deviation (Population) | 14.9% | 12.2% |
Similar Demographics by In Labor Force | Age 45-54
Demographics Similar to Alaskan Athabascans by In Labor Force | Age 45-54
In terms of in labor force | age 45-54, the demographic groups most similar to Alaskan Athabascans are Alaska Native (81.8%, a difference of 0.010%), Celtic (81.8%, a difference of 0.020%), Central American (81.7%, a difference of 0.020%), Puget Sound Salish (81.7%, a difference of 0.040%), and Hmong (81.7%, a difference of 0.060%).
| Demographics | Rating | Rank | In Labor Force | Age 45-54 |
| Immigrants | Thailand | 1.0 /100 | #239 | Tragic 81.9% |
| Immigrants | El Salvador | 1.0 /100 | #240 | Tragic 81.9% |
| Immigrants | Cambodia | 0.8 /100 | #241 | Tragic 81.9% |
| Whites/Caucasians | 0.7 /100 | #242 | Tragic 81.9% |
| Samoans | 0.6 /100 | #243 | Tragic 81.8% |
| Celtics | 0.4 /100 | #244 | Tragic 81.8% |
| Alaska Natives | 0.4 /100 | #245 | Tragic 81.8% |
| Alaskan Athabascans | 0.4 /100 | #246 | Tragic 81.8% |
| Central Americans | 0.4 /100 | #247 | Tragic 81.7% |
| Puget Sound Salish | 0.3 /100 | #248 | Tragic 81.7% |
| Hmong | 0.3 /100 | #249 | Tragic 81.7% |
| Immigrants | Armenia | 0.2 /100 | #250 | Tragic 81.7% |
| Guamanians/Chamorros | 0.2 /100 | #251 | Tragic 81.6% |
| Pennsylvania Germans | 0.2 /100 | #252 | Tragic 81.6% |
| Japanese | 0.2 /100 | #253 | Tragic 81.6% |
Demographics Similar to Eastern Europeans by In Labor Force | Age 45-54
In terms of in labor force | age 45-54, the demographic groups most similar to Eastern Europeans are Paraguayan (83.5%, a difference of 0.010%), Immigrants from Peru (83.5%, a difference of 0.020%), Bhutanese (83.5%, a difference of 0.020%), Carpatho Rusyn (83.5%, a difference of 0.020%), and Filipino (83.5%, a difference of 0.020%).
| Demographics | Rating | Rank | In Labor Force | Age 45-54 |
| Immigrants | Turkey | 98.8 /100 | #51 | Exceptional 83.6% |
| Poles | 98.7 /100 | #52 | Exceptional 83.6% |
| Peruvians | 98.7 /100 | #53 | Exceptional 83.6% |
| Somalis | 98.7 /100 | #54 | Exceptional 83.5% |
| Macedonians | 98.7 /100 | #55 | Exceptional 83.5% |
| Immigrants | Peru | 98.6 /100 | #56 | Exceptional 83.5% |
| Paraguayans | 98.5 /100 | #57 | Exceptional 83.5% |
| Eastern Europeans | 98.5 /100 | #58 | Exceptional 83.5% |
| Bhutanese | 98.3 /100 | #59 | Exceptional 83.5% |
| Carpatho Rusyns | 98.3 /100 | #60 | Exceptional 83.5% |
| Filipinos | 98.3 /100 | #61 | Exceptional 83.5% |
| Immigrants | Taiwan | 98.0 /100 | #62 | Exceptional 83.5% |
| Afghans | 97.9 /100 | #63 | Exceptional 83.5% |
| Immigrants | Kenya | 97.9 /100 | #64 | Exceptional 83.5% |
| Egyptians | 97.9 /100 | #65 | Exceptional 83.5% |