Immigrants from South Eastern Asia vs Immigrants from Caribbean In Labor Force | Age 45-54

COMPARE

Immigrants from South Eastern Asia
Race
Ancestry
AfghanAfricanAlaska NativeAlaskan AthabascanAlbanianAleutAlsatianAmericanApacheArabArapahoArgentineanArmenianAssyrian/Chaldean/SyriacAustralianAustrianBahamianBangladeshiBarbadianBasqueBelgianBelizeanBermudanBhutaneseBlackfeetBolivianBrazilianBritishBritish West IndianBulgarianBurmeseCajunCambodianCanadianCape VerdeanCarpatho RusynCelticCentral AmericanCentral American IndianCherokeeCheyenneChickasawChileanChineseChippewaChoctawColombianColvilleComancheCosta RicanCreeCreekCroatianCrowCubanCypriotCzechCzechoslovakianDanishDelawareDominicanDutchDutch West IndianEastern EuropeanEcuadorianEgyptianEnglishEstonianEthiopianEuropeanFijianFilipinoFinnishFrenchFrench American IndianFrench CanadianGermanGerman RussianGhanaianGreekGuamanian/ChamorroGuatemalanGuyaneseHaitianHmongHonduranHopiHoumaHungarianIcelanderIndian (Asian)IndonesianInupiatIranianIraqiIrishIroquoisIsraeliItalianJamaicanJapaneseJordanianKenyanKiowaKoreanLaotianLatvianLebaneseLiberianLithuanianLumbeeLuxembourgerMacedonianMalaysianMalteseMarshalleseMenomineeMexicanMexican American IndianMongolianMoroccanNative HawaiianNavajoNepaleseNew ZealanderNicaraguanNigerianNorthern EuropeanNorwegianOkinawanOsageOttawaPaiutePakistaniPalestinianPanamanianParaguayanPennsylvania GermanPeruvianPimaPolishPortuguesePotawatomiPuebloPuerto RicanPuget Sound SalishRomanianRussianSalvadoranSamoanScandinavianScotch-IrishScottishSeminoleSenegaleseSerbianShoshoneSierra LeoneanSiouxSlavicSlovakSloveneSomaliSouth AfricanSouth AmericanSouth American IndianSoviet UnionSpaniardSpanishSpanish AmericanSpanish American IndianSri LankanSubsaharan AfricanSudaneseSwedishSwissSyrianTaiwaneseThaiTlingit-HaidaTohono O'OdhamTonganTrinidadian and TobagonianTsimshianTurkishU.S. Virgin IslanderUgandanUkrainianUruguayanUteVenezuelanVietnameseWelshWest IndianYakamaYaquiYugoslavianYumanYup'ikZimbabwean
Immigration
NonimmigrantsImmigrantsAfghanistanAfricaAlbaniaArgentinaArmeniaAsiaAustraliaAustriaBahamasBangladeshBarbadosBelarusBelgiumBelizeBoliviaBosnia and HerzegovinaBrazilBulgariaBurma/MyanmarCabo VerdeCambodiaCameroonCanadaCentral AmericaChileChinaColombiaCongoCosta RicaCroatiaCubaCzechoslovakiaDenmarkDominicaDominican RepublicEastern AfricaEastern AsiaEastern EuropeEcuadorEgyptEl SalvadorEnglandEritreaEthiopiaEuropeFijiFranceGermanyGhanaGreeceGrenadaGuatemalaGuyanaHaitiHondurasHong KongHungaryIndiaIndonesiaIranIraqIrelandIsraelItalyJamaicaJapanJordanKazakhstanKenyaKoreaKuwaitLaosLatin AmericaLatviaLebanonLiberiaLithuaniaMalaysiaMexicoMicronesiaMiddle AfricaMoldovaMoroccoNepalNetherlandsNicaraguaNigeriaNorth AmericaNorth MacedoniaNorthern AfricaNorthern EuropeNorwayOceaniaPakistanPanamaPeruPhilippinesPolandPortugalRomaniaRussiaSaudi ArabiaScotlandSenegalSerbiaSierra LeoneSingaporeSomaliaSouth AfricaSouth AmericaSouth Central AsiaSouth Eastern AsiaSouthern EuropeSpainSri LankaSt. Vincent and the GrenadinesSudanSwedenSwitzerlandSyriaTaiwanThailandTrinidad and TobagoTurkeyUgandaUkraineUruguayUzbekistanVenezuelaVietnamWest IndiesWestern AfricaWestern AsiaWestern EuropeYemenZaireZimbabweAzores
Immigrants from Caribbean
Race
Ancestry
AfghanAfricanAlaska NativeAlaskan AthabascanAlbanianAleutAlsatianAmericanApacheArabArapahoArgentineanArmenianAssyrian/Chaldean/SyriacAustralianAustrianBahamianBangladeshiBarbadianBasqueBelgianBelizeanBermudanBhutaneseBlackfeetBolivianBrazilianBritishBritish West IndianBulgarianBurmeseCajunCambodianCanadianCape VerdeanCarpatho RusynCelticCentral AmericanCentral American IndianCherokeeCheyenneChickasawChileanChineseChippewaChoctawColombianColvilleComancheCosta RicanCreeCreekCroatianCrowCubanCypriotCzechCzechoslovakianDanishDelawareDominicanDutchDutch West IndianEastern EuropeanEcuadorianEgyptianEnglishEstonianEthiopianEuropeanFijianFilipinoFinnishFrenchFrench American IndianFrench CanadianGermanGerman RussianGhanaianGreekGuamanian/ChamorroGuatemalanGuyaneseHaitianHmongHonduranHopiHoumaHungarianIcelanderIndian (Asian)IndonesianInupiatIranianIraqiIrishIroquoisIsraeliItalianJamaicanJapaneseJordanianKenyanKiowaKoreanLaotianLatvianLebaneseLiberianLithuanianLumbeeLuxembourgerMacedonianMalaysianMalteseMarshalleseMenomineeMexicanMexican American IndianMongolianMoroccanNative HawaiianNavajoNepaleseNew ZealanderNicaraguanNigerianNorthern EuropeanNorwegianOkinawanOsageOttawaPaiutePakistaniPalestinianPanamanianParaguayanPennsylvania GermanPeruvianPimaPolishPortuguesePotawatomiPuebloPuerto RicanPuget Sound SalishRomanianRussianSalvadoranSamoanScandinavianScotch-IrishScottishSeminoleSenegaleseSerbianShoshoneSierra LeoneanSiouxSlavicSlovakSloveneSomaliSouth AfricanSouth AmericanSouth American IndianSoviet UnionSpaniardSpanishSpanish AmericanSpanish American IndianSri LankanSubsaharan AfricanSudaneseSwedishSwissSyrianTaiwaneseThaiTlingit-HaidaTohono O'OdhamTonganTrinidadian and TobagonianTsimshianTurkishU.S. Virgin IslanderUgandanUkrainianUruguayanUteVenezuelanVietnameseWelshWest IndianYakamaYaquiYugoslavianYumanYup'ikZimbabwean
Immigration
NonimmigrantsImmigrantsAfghanistanAfricaAlbaniaArgentinaArmeniaAsiaAustraliaAustriaBahamasBangladeshBarbadosBelarusBelgiumBelizeBoliviaBosnia and HerzegovinaBrazilBulgariaBurma/MyanmarCabo VerdeCambodiaCameroonCanadaCaribbeanCentral AmericaChileChinaColombiaCongoCosta RicaCroatiaCubaCzechoslovakiaDenmarkDominicaDominican RepublicEastern AfricaEastern AsiaEastern EuropeEcuadorEgyptEl SalvadorEnglandEritreaEthiopiaEuropeFijiFranceGermanyGhanaGreeceGrenadaGuatemalaGuyanaHaitiHondurasHong KongHungaryIndiaIndonesiaIranIraqIrelandIsraelItalyJamaicaJapanJordanKazakhstanKenyaKoreaKuwaitLaosLatin AmericaLatviaLebanonLiberiaLithuaniaMalaysiaMexicoMicronesiaMiddle AfricaMoldovaMoroccoNepalNetherlandsNicaraguaNigeriaNorth AmericaNorth MacedoniaNorthern AfricaNorthern EuropeNorwayOceaniaPakistanPanamaPeruPhilippinesPolandPortugalRomaniaRussiaSaudi ArabiaScotlandSenegalSerbiaSierra LeoneSingaporeSomaliaSouth AfricaSouth AmericaSouth Central AsiaSouthern EuropeSpainSri LankaSt. Vincent and the GrenadinesSudanSwedenSwitzerlandSyriaTaiwanThailandTrinidad and TobagoTurkeyUgandaUkraineUruguayUzbekistanVenezuelaVietnamWest IndiesWestern AfricaWestern AsiaWestern EuropeYemenZaireZimbabweAzores
In Labor Force | Age 45-54
Income
Poverty
Unemployment
Labor Participation
Family Structure
Vehicle Availability
Education Level
Disability

In Labor Force | Age 45-54 Comparison

Immigrants from South Eastern Asia

Immigrants from Caribbean

Average
Tragic
82.8%
IN LABOR FORCE | AGE 45-54
57.4/ 100
METRIC RATING
166th/ 347
METRIC RANK
82.1%
IN LABOR FORCE | AGE 45-54
2.5/ 100
METRIC RATING
226th/ 347
METRIC RANK

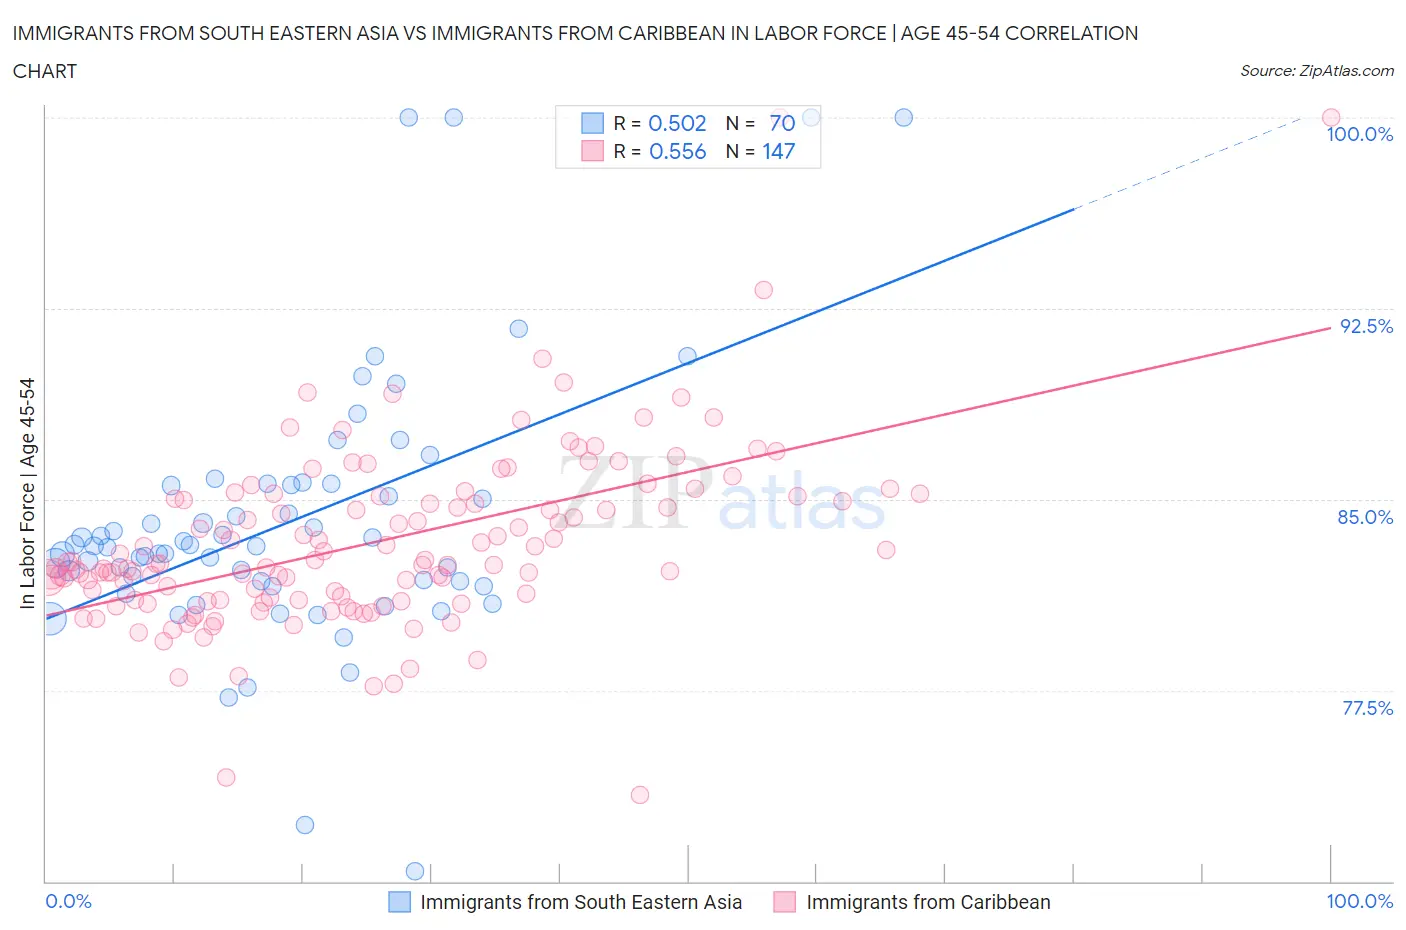
Immigrants from South Eastern Asia vs Immigrants from Caribbean In Labor Force | Age 45-54 Correlation Chart

The statistical analysis conducted on geographies consisting of 512,202,899 people shows a substantial positive correlation between the proportion of Immigrants from South Eastern Asia and labor force participation rate among population between the ages 45 and 54 in the United States with a correlation coefficient (R) of 0.502 and weighted average of 82.8%. Similarly, the statistical analysis conducted on geographies consisting of 449,588,789 people shows a substantial positive correlation between the proportion of Immigrants from Caribbean and labor force participation rate among population between the ages 45 and 54 in the United States with a correlation coefficient (R) of 0.556 and weighted average of 82.1%, a difference of 0.88%.
Immigrants from South Eastern Asia vs Immigrants from Caribbean In Labor Force | Age 45-54

In Labor Force | Age 45-54 Correlation Summary

MeasurementImmigrants from South Eastern AsiaImmigrants from Caribbean
Minimum70.4%73.4%
Maximum100.0%100.0%
Range29.6%26.6%
Mean84.1%83.3%
Median83.2%82.5%
Interquartile 25% (IQ1)81.8%81.1%
Interquartile 75% (IQ3)85.5%85.1%
Interquartile Range (IQR)3.8%4.0%
Standard Deviation (Sample)5.3%3.6%
Standard Deviation (Population)5.2%3.5%

Similar Demographics by In Labor Force | Age 45-54

Demographics Similar to Immigrants from South Eastern Asia by In Labor Force | Age 45-54

In terms of in labor force | age 45-54, the demographic groups most similar to Immigrants from South Eastern Asia are Swiss (82.8%, a difference of 0.010%), Immigrants from South Africa (82.8%, a difference of 0.010%), Immigrants from Sudan (82.8%, a difference of 0.020%), Immigrants from Western Africa (82.8%, a difference of 0.030%), and South American Indian (82.9%, a difference of 0.040%).
DemographicsRating | RankIn Labor Force | Age 45-54
Immigrants | Austria
64.6
/100
|
#159
Good
82.9%
Laotians
62.8
/100
|
#160
Good
82.9%
South American Indians
62.2
/100
|
#161
Good
82.9%
Haitians
61.8
/100
|
#162
Good
82.8%
Dutch
61.7
/100
|
#163
Good
82.8%
German Russians
61.3
/100
|
#164
Good
82.8%
Immigrants | Sudan
59.9
/100
|
#165
Average
82.8%
Immigrants | South Eastern Asia
57.4
/100
|
#166
Average
82.8%
Swiss
56.5
/100
|
#167
Average
82.8%
Immigrants | South Africa
55.8
/100
|
#168
Average
82.8%
Immigrants | Western Africa
54.1
/100
|
#169
Average
82.8%
Pakistanis
53.2
/100
|
#170
Average
82.8%
Immigrants | Zaire
52.9
/100
|
#171
Average
82.8%
Icelanders
51.8
/100
|
#172
Average
82.8%
Nicaraguans
50.3
/100
|
#173
Average
82.8%

Demographics Similar to Immigrants from Caribbean by In Labor Force | Age 45-54

In terms of in labor force | age 45-54, the demographic groups most similar to Immigrants from Caribbean are Immigrants from Oceania (82.1%, a difference of 0.0%), Immigrants from Germany (82.1%, a difference of 0.010%), Immigrants from Jamaica (82.1%, a difference of 0.020%), Cape Verdean (82.1%, a difference of 0.040%), and Immigrants (82.1%, a difference of 0.050%).
DemographicsRating | RankIn Labor Force | Age 45-54
French
4.1
/100
|
#219
Tragic
82.2%
Bahamians
3.6
/100
|
#220
Tragic
82.2%
Panamanians
3.5
/100
|
#221
Tragic
82.2%
Immigrants | Ecuador
3.4
/100
|
#222
Tragic
82.2%
Immigrants | Immigrants
3.1
/100
|
#223
Tragic
82.1%
Immigrants | Jamaica
2.7
/100
|
#224
Tragic
82.1%
Immigrants | Oceania
2.5
/100
|
#225
Tragic
82.1%
Immigrants | Caribbean
2.5
/100
|
#226
Tragic
82.1%
Immigrants | Germany
2.4
/100
|
#227
Tragic
82.1%
Cape Verdeans
2.1
/100
|
#228
Tragic
82.1%
Immigrants | Burma/Myanmar
1.9
/100
|
#229
Tragic
82.0%
Jamaicans
1.8
/100
|
#230
Tragic
82.0%
Immigrants | Senegal
1.7
/100
|
#231
Tragic
82.0%
Immigrants | Portugal
1.7
/100
|
#232
Tragic
82.0%
Malaysians
1.7
/100
|
#233
Tragic
82.0%